Agilent Community
Agilent Community
  • User
  • Site
  • Search the Community
  • User
  • Home
  • Technical Areas
    Technical Areas
    • AssayMap
    • Atomic Spectroscopy
    • Automated Electrophoresis
    • Cell Analysis
    • Consumables
    • CrossLab Connect
      CrossLab Connect
      • Service Management
      • Smart Alerts
    • Dissolution
    • GC
    • GC/MS
    • iLab Operations Software
    • LC
    • LC/MS
    • Life Sciences Reagents
    • Molecular Spectroscopy
      Molecular Spectroscopy
      • Molecular Spectroscopy - UV-Vis & UV-Vis-NIR, FTIR, Raman & Fluorescence
      • 8700 LDIR User Group
      • Transmission Raman User Group
    • Real-Time PCR (qPCR)
    • Sample Preparation
    • Software
      Software
      • Chromatography Software
        OpenLab CDS, OpenLab ChemStation, OpenLab EZChrom
      • Data Management Software
        OpenLab ECM, OpenLab ECM XT, OpenLab Server
      • Mass Spectrometry Software
        Data Analysis, Data Acquisition, Productivity App, WalkUp Software
    • Vacuum
  • Applications Areas
    Applications Areas
    • Basic Research
    • Energy and Chemicals
    • Environmental
    • Food and Agriculture
  • Agilent Knowledge Portal
  • Links
    Links
    • Collection of Support Resources
    • Webinar Notifications
    • Contact Support
    • User Contributions
  • Getting Started
    Community Help and Resources
  • Browse
    Browse
    • People
    • Places
    • Your View
    • Your Community Inbox
Consumables
  • Technical Areas
Consumables
Wiki Help! My Peaks Look Strange - Fronting and Tailing in GC
  • Announcements
  • Forum
  • Files
  • Wiki
  • More
  • Cancel
Actions
  • Share
  • More
  • Cancel
Table of Contents
  • Consumables (GC-, LC-Columns, Sample Prep Cartridges, Vials, Syringes, etc.)
  • A Tip for Preparing Robust and Consistent Mobile Phases
  • Achieve accurate and repeatable gas flow meter measurements
  • AdvanceBio Columns Blog Series
  • Agilent 123 Meter Sodium probe maintenance
  • Agilent Collection of Columns, Supplies, and Standards Resources
  • Allowed Changes in USP Methods
  • Analysis of microplastics in the environment
  • Analyzing ADCs by HIC
  • Avoiding downtime in the lab: top tips for GC/MS success
  • Best Practices for Making Good Connections
  • Bio LC Column User Guides
  • Bursting Tubing and Columns (GC and HPLC)
  • Calculate the Maximum Allowable Working Pressure for Tubing
  • Calculating Column Volume
  • Calculator Overview
  • Cannabis Potency Testing: a Reliable, Cost-Effective Method
  • Checking Your Intuition - Sub 2 µm vs Superficially Porous
  • Choosing the right GC Injection Technique
  • Choosing the right pore size for size exclusion chromatography
  • Chromosorb - Properties of the Most Used Support Material in Packed GC
  • Columns, Supplies, and Standards Knowledgebase
  • Consumables Applications and Workflows
  • Consumables Recommended Supplies Lists for Agilent.com
  • Conversion of Packed Column Dimensions to Capillary Column Dimensions
  • Custom Product Request
  • Dynamic Gas Viscosities
  • Extreme Makeover – Derivatizations in Chromatography – Part 1 GC
  • Extreme Makeover – Derivatizations in Chromatography – Part 2 LC
  • Fake It Until You Make It: When BioInert Isn’t an Option
  • Flipping Amino Acid Analysis on Its Head
  • GC - Calculation of the Maximum Gaseous Injection Volume
  • GC - Hydrocarbon Analyses and Hydrocarbon Properties
  • GC - Optimal Head Pressures and Flows for Capillary PLOT Columns
  • GC - Packed Column Pressures and Flows
  • GC - Simulated Distillation Analyses (SimDist/SimDis)
  • GC - Solvent Vapour Volume Calculator
  • GC - Troubleshooting - Where do those Spikes come from?
  • GC and GC/MS Columns - USP Designations
  • Glycans at a glance:  Analyzing therapeutic glycoproteins
  • Handle and Care of Syringes
  • Help! My Peaks Look Strange - Fronting and Tailing in GC
  • Help! My Peaks Look Strange - Saddle Points - LC/GC Troubleshooting
  • How do I select a Split/Splitless liner?
  • HPLC - A Beginner’s Guide to Hydrophobic Interaction Chromatography
  • HPLC - A simple tip to protect your columns
  • HPLC - Advantages of small(er) ID Columns
  • HPLC - Best Practices for Aqueous Mobile Phases
  • HPLC - Carbohydrate Analyses in LC
  • HPLC - How to extend the column lifetime
  • HPLC - Solvent Strength - Isoeluotropic Solvent Mixtures
  • HPLC - The Art of LC Trouble-Shooting, a General Approach
  • HPLC - Troubleshooting - Retention Changes and Peak Splitting
  • HPLC - Troubleshooting HPLC Autosamplers
  • HPLC - Troubleshooting HPLC degassers
  • HPLC - What Happens in Reversed-Phase HPLC?
  • Hydrophobic Interaction Chromatography of Proteins and mAbs
  • Importance of Silica Particle Strength for Sub-2 µm SEC Columns
  • KB: Ferrules recommended for GC self-tightening column nut
  • LC and LC/MS Columns - USP Designations
  • LC Column User Guides
  • LC Method Translation - the Dwell Volume
  • LC Method Translation - the Method Translator App
  • Mesh Sizes and Openings
  • Minimize spectroscopy workflow disruptions
  • Minimizing Metals for Best HILIC Results
  • More than just a drink: Analyzing the elemental composition of beer
  • Multi-Attribute Methods – Peptide Mapping Part IV
  • Must See Webinars
  • Nomenclature of CFC's/Freons/Halons/Coolants
  • Oligonucleotide Analysis - Unexpected Details Matter
  • Optimizing Bonding Chemistry for Sub-2 µm SEC Particles
  • Pass the Salt, Please – Mobile Phase Preparation for HIC
  • Pesticides and their stability during GC analyses
  • Pre-Columns - the forgotten art of using retention gaps
  • Problematic polar analytes? Hello HILIC…
  • Protecting your laboratory productivity
  • Recommended Reading
  • Sample Prep Pointers - Peptide Mapping Part I
  • Save your results with sample filtration
  • Simplified cone inspection with the new Agilent LED measuring magnifier
  • Software - Supported Method Development - The Scanview Application
  • Software tool for the ADM Flow Meter (G6691A)
  • Solvent Polarities and Elution Strengths, UV Cut-offs and Refractive Indices
  • SPE - How to use the polymeric SPE phases of the PLEXA Family
  • SPE - Optimize Your Solid Phase Extraction-Method
  • SPME - Introduction to Solid-Phase Micro Extraction
  • Stay Safe: A Win-Win for Solvent Storage
  • Streamline your sample processing
  • The importance of chemical composition for vial performance
  • Tips & Tricks for Amino Acid Analysis – Part I
  • Tips & Tricks for Amino Acid Analysis – Part II
  • Tips & Tricks for Amino Acid Analysis – Part III
  • Tips & Tricks for Amino Acid Analysis – Part IV
  • Tips for Smooth Sailing with HIC
  • Troubleshooting Posters
  • Troubleshooting Sequence Coverage – Peptide Mapping Part III
  • UltiMetal Plus Flexible Metal Ferrule
  • UV, MS, TFA, and Formic Acid – What to use? Peptide Mapping Part II
  • Water Content of Air ...
  • What are the typical % Gain or EHT values for hollow cathode lamps?
  • Wire Diameter Standards - the Gauge Number
  • You Need Lamps or Chemical Standards for Atomic Absorption Single-Element Analyses?
Still Need Help?

Post your question in our User Forum or Contact Support.

Help! My Peaks Look Strange - Fronting and Tailing in GC

Created by Dr. Know Dr. Know over 3 years ago | Last modified by Dr. Know Dr. Know over 2 years ago

Overloading Effects in Gas Chromatography

Norbert Reuter, Technical Manager, Global Technical Support for CSD, Middelburg, The Netherlands

Introduction

Overloading effects are strongly related to the sample capacity of stationary phases in gas chromatography. If this sample capacity is exceeded, the peak shapes are influenced and therefore give an indication of the effect. Overloading always shows in fronting peaks and influences the resolution within a chromatogram. For accurate analyses (robust quantification, etc.) overloading should be avoided.


Wall-Coated Open Tubular Columns (WCOT)

In WCOT columns, we have liquid stationary phases and partitioning chromatography. Partitioning means one or more components are distributed between the mobile phase (carrier gas) and the stationary phase. The process can be described as a mixture of the components in the phases.

Henry’s Law (Equation 1) describes thermodynamically mixtures of gases in liquids. It says: “At a constant temperature, the amount of a given gas dissolved in a given type and volume of liquid is directly proportional to the partial pressure of that gas in equilibrium with that liquid.”

Henry's Law:                pi = kH · ci                                                                                                                                                                                                        (1)
p = partial pressure of the solute in the gas phase
kH = Henry constant
c = concentration of the solute in the liquid phase


For dilute mixtures, the relation is linear and is the basis of the ideal Gaussian peaks shapes. WCOT columns have high phase ratios, meaning that the stationary phase is the minority phase.


Phase ratio for capillary columns:              β = Vgas / Vliquid = 250 · df / ID                                                                                                     (2)
Vgas = Volume of the gas phase
Vliquid = Volume of the liquid phase
df = film thickness in [µm]
ID = Internal diameter in [mm]


Overloading occurs when the sample capacity of the liquid phase is exceeded; Henry’s Law is no longer valid and deviates from linearity. There is more sample present in the carrier gas and this sample is transported with the carrier gas flow to the end of the column and arrives there earlier than expected. The peak shows fronting.


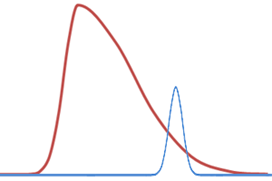
               (a) WCOT column overloading                                             (b) PLOT column overloading


Figure 1: Peak shapes of an overloaded peak (dark red) vs. ideal peaks (light blue)


Porous-Layer Open Tubular Columns (PLOT)

Henry’s Law is only valid for mixtures of a gas in a liquid and, therefore, for partitioning chromatography. PLOT columns are used for adsorption chromatography; here Henry’s Law has to be exchanged with the Langmuir adsorption equation (Equation 3).

Langmuir equation:          θ = α · Pi / (1 + α · Pi)                                                                                                                            (3)
θ = fractional surface coverage
α = Adsorption constant
P = partial gas pressure or concentration

      
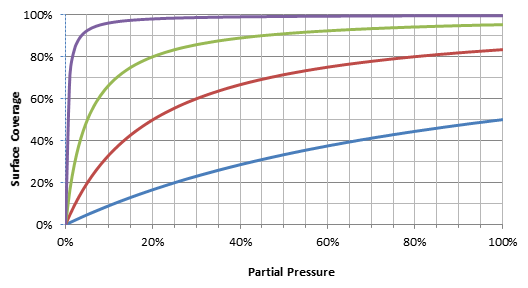
          Figure 2: Langmuir adsorption isotherms for different adsorption constants

With increasing partial pressure, the surface cannot adsorb sample components any longer. The active places are already occupied, and the overloading happens then in the gas phase, producing often a triangular peak shape. The peak starts earlier than expected and the peak ends at the normal position. Due to the shape it seems that the peak shows tailing, which is not the case (see Figure 1b). The best region for separations on PLOT columns is in the linear range of the Langmuir isotherm. In the example here: up to 100% in the partial pressure range for the blue, 20% for red, 5% for green and 2% for the violet line.


Sample Capacity

The sample capacity is for every combination of sample component and liquid or solid phase different. For the liquid phases, imagine the solution of salt and sugar in a glass of water. The maximum solubility for salt is ca. 380 g/L, whereas for sugar it is ca. 675 g/L.

To make it even more complicated, the maximum salt (sugar) solubility in water at 20 °C is 380 g/L (675 g/L), but 400 g/L (810 g/L) at 90 °C. The solubility is temperature-dependent and changes along the temperature program in a gas chromatographic run! For gases, there is also a pressure-dependence, because in equilibrium the gaseous component would rather dissolve in the phase than being in the carrier gas.

But there is also a positive point; the sample capacity is independent from the number of different components. In the salt/sugar example, the water would dissolve 380 g salt and 675 g sugar in 1 L at the same time.

In the empirical and pragmatic theory of mass capacity, the maximum amount of component can be estimated by Equation 4:

wmax   =   a · Vphase · (1 + 1/k) / √ Nth   =   a · 2π · ID · df · (1 + 1/k) / √ Nth                              (4)
wmax = maximum amount of component
a = characteristic constant of the phase/component interaction
Vphase = Volume of the liquid stationary phase
k = retention factor of component
Nth = plate number
ID = internal diameter of the column 
df = film thickness

The characteristic constant, a, can be determined by experiments. The sample capacity is also dependent on the size of the component or rather its retention factor. The bigger the retention factor, the smaller is the sample capacity. In the picture of size, bigger molecules occupy more space in the phase and, therefore, you need fewer molecules to saturate the phase (see Figure 2).


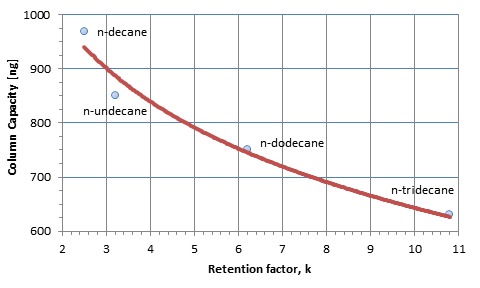
                  Figure 3: Sample capacity of a 25 m x 0.53 mm x 2.0 µm CP-Sil 5 CB column at 100 °C


Also, in all these cases the chromatographic likes-like principle is valid. Apolar components dissolve in an apolar phase easily and show almost no overloading. A polar component like acetic acid, for example, will dissolve less easily in an apolar phase and is therefore quickly overloaded. For polar components, a polar phase would be better.

Overloading in its extreme form is called flooding and flooding effects distort peak shapes until they are almost unidentifiable. They lead to peak shapes that almost look like Christmas trees and the effect is also called the Christmas-tree effect. It is related to too much injected volume and miniature temperature variations in the mix zone, giving much peak splitting.


Overloading and Resolution

Overloading leads to broader peaks with broader peak widths; if you remember the resolution equation, broader peaks decrease the resolution.


Resolution:     Rs   =   2 · Δ(tR) / Σ(b0.5)    =    2 · (tR,2 - tR,1) / (b0.5,1 + b0.5,2)                                            (5)
tR = retention times of peaks 1 and 2
b0.5 = peak width at half height of peaks 1 and 2


Purnell equation:          Rs   =   ¼ · (α - 1) · kav / (kav + 1) · √ Nth                                                                                         (6)

α = selectivity 
kav = average retention factor for peaks 1 and 2
Nth = plate number


Plate number:          Nth   =    5.54 · (tR / b0.5)²                                                                                                                                                      (7)

tR = retention time
b0.5 = peak width at half height


If the denominator increases, the resolution decreases (Equation 5). If the retention factors and the phase selectivity do not change during overloading, the resolution is proportional to the square root of the plate number (Equation 6). The plate number is inversely proportional to the square of the peak width at half height (Equation 7). If the peak width increases by 10%, the resolution decreases by 10%. The user must decide, what the acceptable decrease in resolution is, depending on the application.


Solutions

There is a solution to all overloading effects: reduce sample amounts or increase the amount of phase.

  1. The amount of phase can be increased using thicker films, longer columns (more phase, but also more diffusion and band broadening) and/or using columns with bigger internal diameters. The injection volume needs to be constant
  2. The reduction in sample amount can be achieved by injecting less, using a higher split flow
  3. A third solution is working at higher temperatures (better dissolution of components in the phase)


Estimated Sample Capacities of Capillary Columns


Film thickness

0.12 µm

0.40 µm

1.20 µm

2.00 µm

5.00 µm

Internal
diameter

0.15 mm

1–10 ng

3–30 ng

10–100 ng

20–200 ng


0.25 mm

2–50 ng

6–150 ng

20–500 ng

30–800 ng


0.32 mm

5–100 ng

15–400 ng

50–1000 ng

80–1500 ng

160–3000 ng

0.53 mm


50–1200 ng

100–2000 ng

200–5000 ng

            Table 1: Estimated sample capacities for different column dimensions


Conclusions

To avoid overloading in gas chromatography, you can:

  • Inject less
  • Use higher split flows (more goes to vent, less onto the column)
  • Use columns with thicker films (more film, more loadability)
  • Use columns with bigger internal diameters (also more film and more loadability)
  • Work at elevated temperatures (thermodynamic influence, solubility in phase increases)


  • A combination of all these items 
  • overloading
  • Troubleshooting
  • gc columns
  • General
  • GC
  • Share
  • History
  • More
  • Cancel
  • Sign in to reply
Was this helpful?
  • Yes
  • No
Thank you for your feedback!

Agilent Community Feedback

Agilent Community Feedback

×
We are glad this was helpful! We are sorry this was not helpful. If you still need assistance please create a community post or contact support. To help us improve, please provide any additional feedback. For full details of how we will treat your information, please view our privacy policy.
Submit Cancel
Submit Cancel
Related
Privacy Statement
Terms of Use
Contact Us
Site Help