There are many sample preparation techniques used in GC and HPLC. However, these methods may pose some inherent disadvantages; they require large volumes of organic solvents, they can be time consuming and they involve multi-step processes which present the risk of analyte loss ... and then there is SPME — a simple, inexpensive and often forgotten technique. Refresh your sample prep tool kit with SPME and improve your analyses.
Introduction
Solid phase micro-extraction, is a solvent less sample preparation technique introduced by Belardi en Pawliszyn in 1989 [1]. In SPME, an easy-to-use device containing a coated fiber to concentrate volatile and semi-volatile organics extracts target analytes from the matrix in one step.
The Simplicity of SPME
SPME consists of two processes:
- Partitioning of analytes between the coating and the sample
- Desorption of concentrated analyte into the analytical instrument
The first process can be illustrated with the following figure:
| Time | t0 | t1 | t2 | t3 | t4 | |||
|---|---|---|---|---|---|---|---|---|
| Duration | 0 | 0 | 15-30 Minutes | 0 | 0 | |||
 |
 |
 |
 |
 |
||||
| Start | Pierce Septum of Sample Vial |
Extend Fiber and Incubate |
Retract Fiber from Sample |
Retract Fiber Holder from Sample Vial |
Figure 1: Direct-Extraction SPME Process
The SPME method consists of inserting the SPME device into the sample matrix and pushing the plunger to expose the fiber to the sample. The target analytes are transferred from the matrix into the coating of the fiber. After reaching the equilibrium state the fiber is retracted into the needle and removed from the sample vessel. The fiber with the extracted and concentrated analytes can now be put into an instrument for desorption (GC injector or HPLC desorption unit), followed by the separation and quantification of the analytes.
During desorption of the analytes, the polymeric phase is cleaned and, therefore, ready for reuse. A fiber may be reused up to 50 times.
Besides the direct-extraction where the fiber is extended into the liquid sample, SPME can also be used in headspace mode, where the fiber is exposed to the gas above the sample [3].
Direct injections are used for gaseous and relatively clean samples. The headspace method is applicable to more complex samples that contain oil, grease or even solids, when the analytes are volatile. The advantages of headspace mode are a cleaner extract, increased speed and the fiber has a longer lifetime.
 |
 |
|||||
| Direct Extraction | Headspace Sampling |
|---|
Figure 2: Direct-Extraction and Headspace Sampling
The Equilibrium
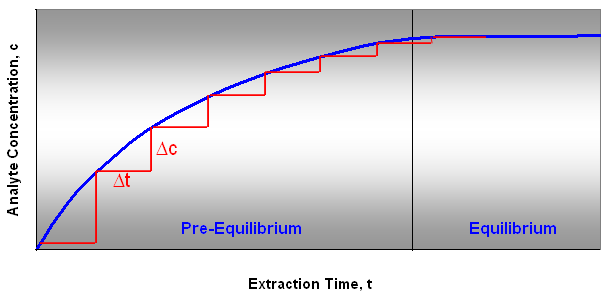
Directly after the fiber is exposed to the sample the analytes start to adsorb onto the coating of the fiber. After the equilibration time the concentration ratios of the analyte on the fiber and in the sample have reached a steady equilibrium. This can take from 30 seconds to 15-30 minutes. When the equilibrium is reached, the process of adsorption and desorption to the fiber is constant and the concentration of the analyte is not changed over time (Figure 3).

Figure 3: Analyte Extraction Curve
A variation in exposure time during sampling will also result in variations in analyte concentration on the fiber, until equilibrium is reached. When the equilibrium is reached a small change in extraction time results in small or no change in the amount of analyte adsorbed.
The extraction time is critical if the equilibrium is not reached. In the pre-equilibrium stage, the left area in the analyte extraction curve diagram, a small change in extraction time will result in a large change in the amount of analyte adsorbed,
(Δc/Δt)pre-equilibrium » (Δc/Δt)equilibrium.
During a time, Δt, the concentration change, Δc, in the pre-equilibrium stage is larger than at the equilibrium stage (Figure 3). In the equilibrium stage Δc/Δt = 0.
Controlling the extraction time is critical when working in the pre-equilibrium period; a stopwatch is needed to time each extraction precisely.
Since extraction time is a very critical parameter and should be as short as possible, it is important to know what parameters influence the extraction time.
The size of the compounds, type of fiber coating, direct- or headspace technique and sample concentration are some of those parameters. Due to the higher diffusion coefficients, gaseous samples have a lower extraction time than liquid samples. To speed up the extraction time a certain level of agitation can be used like vial movement, stirring or sonication.
The Choice of the Fiber

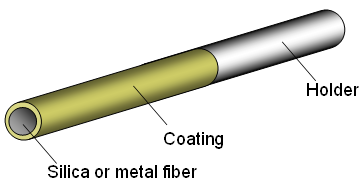
Figure 4: Assembly of a SPME Fiber
The fiber is the heart of the SPME technique and can be thought of as a very short chromatography column turned inside out. It has a fused silica or metal core with a coating on the outside. This coating or phase can be a polymeric liquid or a solid sorbent. By changing the phase the selectivity of the fiber is changed and can be tuned to fit the application.
Not only can the type of coating be changed but also the coating's thickness. The temperature can be varied to improve the sensitivity of the application. In many cases several fiber options are available to extract a particular class of analytes.
Coating Thickness of a Fiber
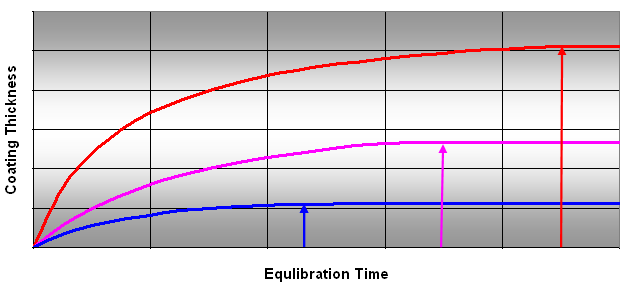
The quantity of the analyte in the sample is another parameter influencing the fiber choice. The quantity of the analyte extracted is directly proportional to the volume/amount of the phase. The thicker the film of the coating the more analyte can be extracted from the sample. This means that the thickness of the fiber coating can be changed to increase the sensitivity in the further analysis.
In general, doubling the thickness of the fiber coating can double the mass of the analyte adsorbed at equilibrium stage. On the other hand, a thicker coating also increases the equilibration time, as shown in Figure 5. Thinner coatings are used when a minimum extraction time is desired. They are also used when larger analytes need to be extracted. Larger analytes are more slowly adsorbed because of the slow migration in and out of the fiber coating. A thinner coating can retain a large portion of these analytes and is more adequate for larger analytes. In general, volatile compounds require a thick coating while semi-volatiles require a thin coating.

Figure 5: Effect of Coating Thickness on Extraction Time
For good reproducibility of the extraction the adsorption and desorption times must be consistent, only then is it possible to achieve the best accuracy.
Fiber Polarity
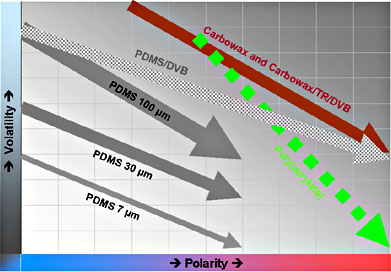
Different type of sorbents will extract different groups of analytes; therefore, many different fiber coatings have been developed. Similar to selecting an analytical GC column where “like dissolves like”, a fiber is chosen based on its selectivity for certain target analytes and their volatility ranges.
Choosing a fiber coating that is more selective for a certain analyte will increase the sensitivity. For instance, a non-polar fiber coating retains hydrocarbons very well. And if a more polar polymer coating is used then more polar components can be analyzed at lower concentrations.
The affinity of the fiber coating for target analytes is crucial in SPME sampling because both matrix and fiber coating are competing for analytes. Analytes with a high affinity for the fiber coating do not require the use of a thick fiber coating to achieve good sensitivity. Also, a lack of affinity for the interfering compounds can play a role in the fiber choice.
 |
PDMS: Polydimethylsiloxane DVB: Divinylbenzene-Styrene Co-Polymer Carbowax: Polyethylene Glycol |
Figure 6: Coating Selectivity's based on Component Volatilities and Polarities [2]
Applicable Mass Range of Analytes

Figure 7: Fiber Type/Analyte Mass Relation [2]
Analyte Classes and Recommended Fibers
| Analyte Class | Fiber Type | Linear Range |
|---|---|---|
| Acids (C2 - C8) | Carboxen/PDMS | 10 ppb - 1 ppm |
| Acids (C2 - C15) | Carbowax/DVB | 50 ppb - 50 ppm |
| Alcohols(C1 - C8) | Carboxen/PDMS | 10 ppb - 1 ppm |
| Alcohols (C1 - C18) | Carbowax/DVB | 50 ppb - 75 ppm |
| Poly(acrylate) | 100 ppb - 100 ppm | |
| Aldehydes (C2 - C8) | Carboxen/PDMS | 1 ppb - 500 ppb |
| Aldehydes (C3 - C14) | PDMS (100 µm) | 50 ppb - 50 ppm |
| Amines | PDMS/DVB | 50 ppb - 50 ppm |
| Amphetamines | PDMS (100 µm) | 100 ppb - 100 ppm |
| PDMS/DVB | 50 ppb - 50 ppm | |
| Aromatic amines | PDMS/DVB | 5 ppb - 1 ppm |
| Barbiturates | PDMS/DVB | 500 ppb - 100 ppm |
| Benzidines | Carbowax/DVB | 5 ppb - 500 ppb |
| Benzodiazepines | PDMS/DVB | 100 ppb - 30 ppm |
| Esters(C3 - C15) | PDMS (100 µm) | 5 ppb - 10 ppm |
| Esters (C6 - C18) | PDMS (30 µm) | 5 ppb - 1 ppm |
| Esters (C12 - C30) | PDMS (7 µm) | 5 ppb - 1 ppm |
| Ethers (C4 - C12) | Carboxen/PDMS | 1 ppb - 500 ppb |
| Explosives (Nitroaromatics) | PDMS/DVB | 1 ppb - 1 ppm |
| Hydrocarbons(C2 - C10) | Carboxen/PDMS | 10 ppb - 10 ppm |
| Hydrocarbons (C5 - C20) | 100 µm PMS | 300 ppt - 1 ppm |
| Hydrocarbons (C10 - C30) | PDMS (30 µm) | 100 ppt - 500 ppb |
| Hydrocarbons (C20 - C40+) | PDMS (7 µm) | 5 ppb - 500 ppb |
| Ketones (C3 - C9) | Carboxen/PDMS | 5 ppb - 1 ppm |
| Ketones (C5 - C12) | PDMS (100 µm) | 5 ppb - 10 ppm |
| Nitrosamines | PDMS | 1 ppb - 200 ppb |
| PAHs | PDMS (100 µm) | 500 ppt - 1 ppm |
| PDMS (30 µm) | 100 ppt - 500 ppb | |
| PDMS (7 µm) | 500 ppt - 500 ppb | |
| PCBs | PDMS (30 µm) | 50 ppt - 500 ppb |
| Pesticides, chlorinated | PDMS (100 µm) | 50 ppt - 500 ppb |
| PDMS (30 µm) | 25 ppb - 500 ppb | |
| Pesticides, nitrogen | Poly(acrylate) | 50 ppt - 500 ppb |
|
Pesticides, phosphorus |
PDMS (100 µm) | 100 ppt - 1 ppm |
| Poly(acrylate) | 100 ppt - 500 ppb | |
| Phenols | Poly(acrylate) | 5 ppb - 500 ppb |
| Surfactants | Carbowax/TPR | 1 ppm - 100 ppm |
| Sulfur gases | Carboxen/PDMS | 10 ppb - 10 ppm |
| Terpenes | PDMS (100 µm) | 1 ppb - 10 ppm |
| Volatile Organics | Carboxen/PDMS | 100 ppt - 500 ppb |
| PDMS (100 µm) | 20 ppb - 50 ppm | |
| PDMS (30 µm) | 100 ppb - 50 ppm |
Table 1: Analyte Classes, Recommended Fiber and Linear Range of Extraction [2]
Temperature Effects and Sensitivity
Besides choosing the right coating and coating thickness, the sample temperature is also an important parameter in optimizing the method sensitivity.
Generally, increasing the sample temperature will increase the sensitivity for the higher boiling components, but decrease the sensitivity for the lower boiling components. Temperature also affects the equilibrium during extraction; increasing the temperature will decrease the equilibration time. Be aware that variations in temperature during the extraction step can cause non-reproducible results.
Instrumental Remarks
Samples that contain volatile or semi-volatile organic compounds can be extracted by using the headspace method for a solid sample or immersing the fibers in a liquid or gas sample.
After the fiber is retracted from the sample vessel, the concentrated analytes can be transferred to a gas chromatograph and thermally desorbed in the injector, followed by separation and quantification.
Samples that contain low volatility compounds can be extracted by fibers designed for use with high performance liquid chromatography and can be desorbed directly in an SPME/HPLC interface or using a desorption solvent, which can be injected using a conventional injector or auto sampler.
Conclusions
SPME:
- is a unique sample preparation technique that eliminates most drawbacks of other existing extraction techniques.
- separates the matrix from the target analytes and concentrates volatile and semi-volatile organics in one extraction step.
- is an easy-to-use technique that does not require solvents and is not time consuming.
- can be used with manual injection or as part of an auto sampler for HPLC and GC applications.
References
- J. Pawliszyn; SPME Research Group, Department of Chemistry, University of Waterloo, Canada (www.spme.uwaterloo.ca).
- S. A. Scheppers Wercinski (Ed.); “Solid Phase Micro Extraction, A Practical Guide”; Marcel Dekker, New York (1999), ISBN-13: 9780824770587.
- Z. Zhang, J. Pawliszyn; “Headspace Solid Phase Micro Extraction”, Anal. Chem. 65 (1993) 1843-1852.
- Z. Zhang, M. J. Yang, J. Pawliszyn; “Solid-Phase Micro Extraction, A Solvent-Free Alternative for Sample Preparation”; Anal. Chem. 66 (1994) 844-853.
