Which Parameters Influence HPLC Separations?
Eric de Witte, Norbert Reuter*, Global Technical Support for CSD, Middelburg, The Netherlands
Introduction
In liquid chromatography, the reversed-phase (RP) mode is everywhere. Even with a growing number of hydrophilic interaction chromatography (HILIC) applications, RP HPLC is the most common technique. This is a summary of what happens when the column parameters are changed.
Increase Chain Length
RP phases carry different organic ligands, starting from C1, C2, C3, C4, C6 and C8, to C18 or even longer. The longer the alkyl chain, the stronger are the apolar interactions (mainly London forces); the hydrophobicity increases and the hydrophilicity decreases. Stronger interactions lead to stronger retention, i.e. larger retention factors, k, which also mean longer run times. The separation is strongly influenced for the early eluting peaks (k < 5) and very little for the late eluting peaks, because for the late eluting peaks, the k/(k + 1) term in the resolution equation almost doesn’t change.
Equation 1: The Resolution Equation
Table 1: Effects summary of increase in chain length
| Analysis Time |
Separation of Early Eluting Peaks |
Separation of Late Eluting Peaks |
Loadability |
Solvent Use |
Backpressure |
|---|---|---|---|---|---|
|
Increase |
Improved but |
No change |
No change |
Increase, due to increase in runtime |
No significant change |
Increase Ligand Density
The ligand density is strongly related to the above change in chain length. We need to consider carbon load (total organic carbon in the phase in percent) and ligand density (number of ligands per square meter of the base material). They cannot be considered independent from each other. A rule of thumb says that lower ligand densities always give more polar interactions and less hydrophobic ones, due to an increase in silanol interaction.
The ligand density can easily be calculated from parameters that come with the phase, like carbon content, surface area and molecular weight of the used reagent [1, 2]:

α1 Ligand Density in [µmol/m2] p1 Carbon Content in [%] S0 BET Surface Area in [m2/g] C Mass of a Carbon Atom (12.01115 g/mol) n1 Number of Carbon Atoms in Anchored Group M1 Molecular Weight of the Anchored Group in [g/mol] (for monofunctional phases M1 = 58 + MWgroup) Example for monofunctional C18 (-Si(CH3)2C18H37): M1 = 58 + 18 * 12 + 37 = 311 g/mol, n1 = 18 + 2 = 20
Equation 2: Berendsen-de Galan Equation [3, 4]
Table 2: Effects summary of increase in ligand density
| Analysis Time |
Separation of Early Eluting Peaks |
Separation of Late Eluting Peaks |
Loadability |
Solvent Use |
Backpressure |
|---|---|---|---|---|---|
|
Increase |
Increase, but |
Selectivity change |
Increase |
Increase, due to increase in runtime |
No significant change |
Increase Organic Modifier Content
The typical rule of thumb for the relation between organic modifier content and retention is, that an increase of 10-15% of the organic modifier leads to a decrease in net retention of 50%, and vice versa.
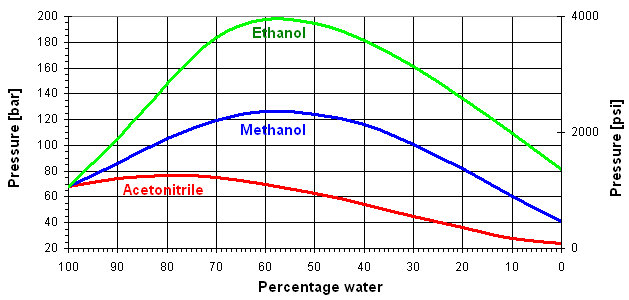
The backpressure of an HPLC column depends upon, amongst other parameters, the viscosity, η, of the eluent:
ΔP ∝ η
The change in viscosity for the solvent mixtures water/ethanol, water/methanol and water/acetonitrile is shown in Figure 1.

Figure 1: Viscosity change of eluent mixtures and corresponding pressure drop
Table 3: Effects summary of increase in organic modifier content
| Analysis Time |
Separation of Early Eluting Peaks |
Separation of Late Eluting Peaks |
Loadability |
Solvent Use |
Backpressure |
|---|---|---|---|---|---|
|
Shorter |
Decrease ( smaller k) |
Small decrease |
No change |
Decrease, due to decrease in runtime |
Change |
Change Column Length
The column length directly influences the amount of phase, number of plates, run time, backpressure and resolution via the number of plates (see Equation 1). After doubling the column length, the resolution increases by the factor √2.
Table 4: Effects for doubling the column length
| Analysis Time |
Separation of Early |
Separation of Late |
Loadability |
Solvent Use |
Backpressure |
|---|---|---|---|---|---|
|
Double |
Positive effect |
Positive effect |
Double |
Double |
Double |
Change Internal Diameter
Changing the column’s internal diameter influences the amount of phase and the internal volume directly. Because the internal diameter is squared in the volume calculations the influence is also squared.
Table 5: Results of doubling the internal diameter of an HPLC column
| Analysis Time |
Separation of Early |
Separation of Late |
Loadability |
Solvent Use |
Backpressure |
|---|---|---|---|---|---|
|
No change |
No change |
No change |
Quadruple |
Quadruple |
No change |
Change Particle Size
Changing the particle size of the packing material, when going to smaller particles, leads to higher flow restrictions and a more efficient separation. The backpressure increases with smaller particles:
ΔP ∝ 1/dp2
Table 6: Results for decreasing the particle size
| Analysis Time |
Separation of Early |
Separation of Late |
Loadability |
Solvent Use |
Backpressure |
|---|---|---|---|---|---|
|
No change |
Positive effect |
Positive effect |
No change |
No change |
(Strong) Increase |
Conclusion
With all the above in mind, it is easy to change operating conditions to improve performance of an analysis. However, only change one parameter at a time to see the effects of each change.
References
- G. E. Berendsen, L. De Galan; “Role of the chain length of chemically bonded phases and the retention mechanism in reversed-phase liquid chromatography”; J. Chromatogr. A 196 (1980) 21-37.
- K. D. Lork, K. K. Unger; “Solute retention in reversed-phase chromatography as a function of stationary phase properties: Effect of n-alkyl chain length and ligand density”; Chromatographia 26 (1988) 115-119.
- G. E. Berendsen, L. De Galan; “Preparation and Chromatographic Properties of Some Chemically Bonded Phases for Reversed-Phase Liquid Chromatography”; J. Liq. Chromatogr. 1 (1978) 561.
- J. E. Sandoval; “Equation for Calculating Surface Coverage from End-Capping of Chromatographic Bonded Phases”; J. Chromatogr. A 852 (1999) 375.

