I tried to copy EIC Signal description items near each other and I don't know how to avoid this problem showed below.
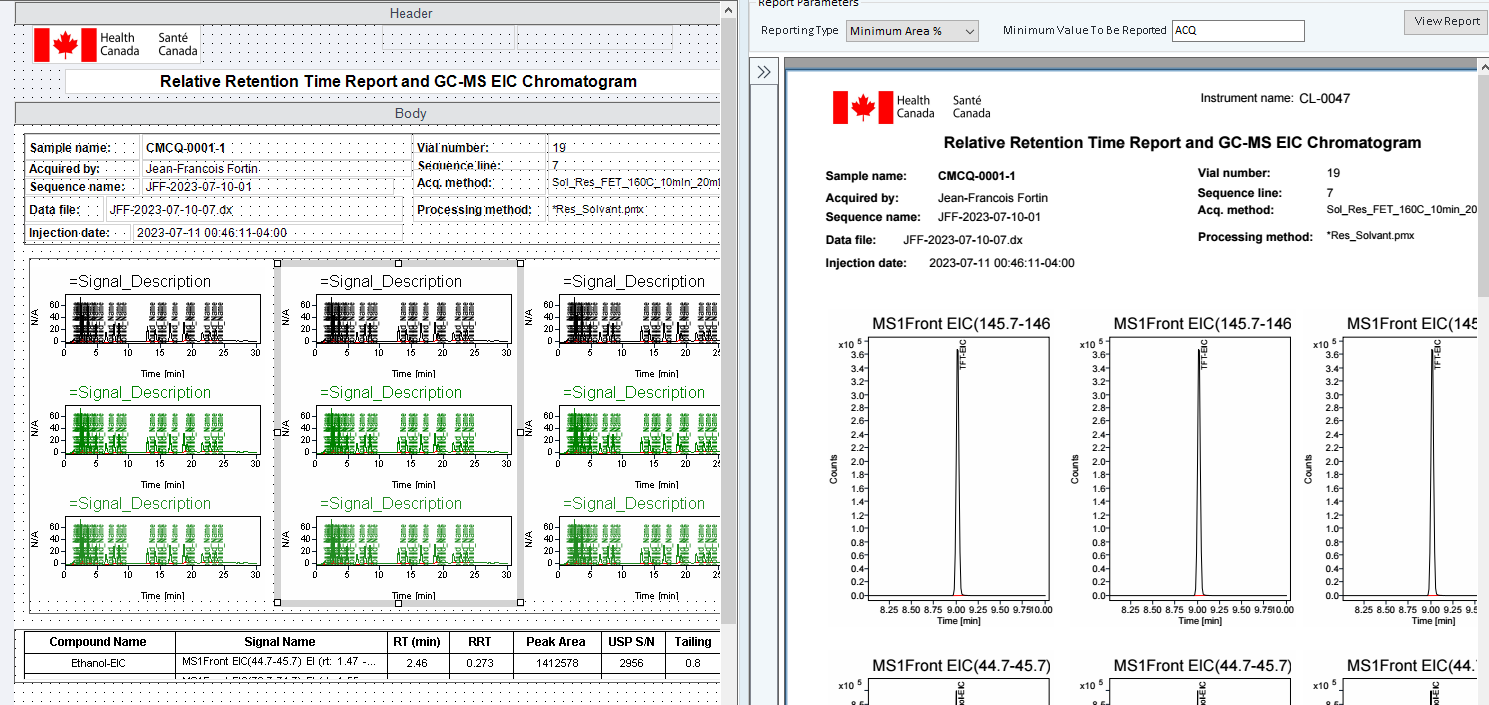
As you can see, the three chromatogram is the same compound. How can I avoid this repetition?
thank you for your help.
I tried to copy EIC Signal description items near each other and I don't know how to avoid this problem showed below.

As you can see, the three chromatogram is the same compound. How can I avoid this repetition?
thank you for your help.
Hello,
Try the MS Chromatogram Flowlayout object instead of the individual chromatograms.
Marty

Hi Martin. I have the same problem. I don't know how to manage the group repeating so we can have different compound name on chromatogram lighted in gray.
it works but I obtained a value of 1. It is supposed to be 10. I put 10 as multiplier in the calibration table and it also works to calculate concentration in ppm (ug/g).
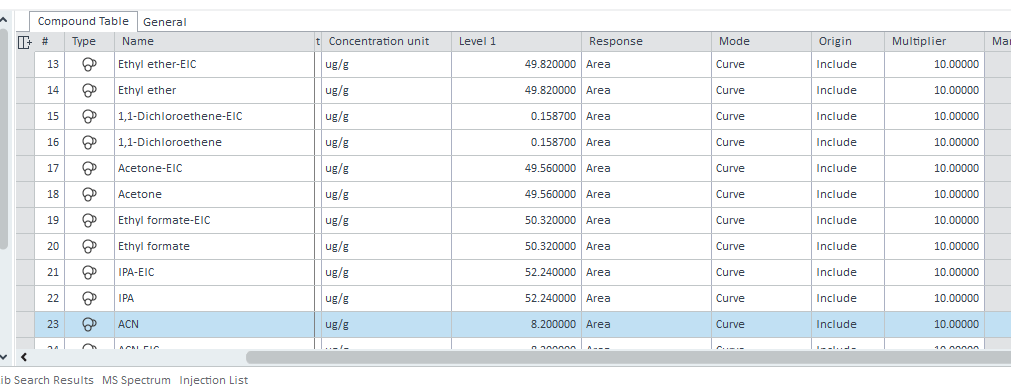
But in the injection list, the five multiplier are at 1.
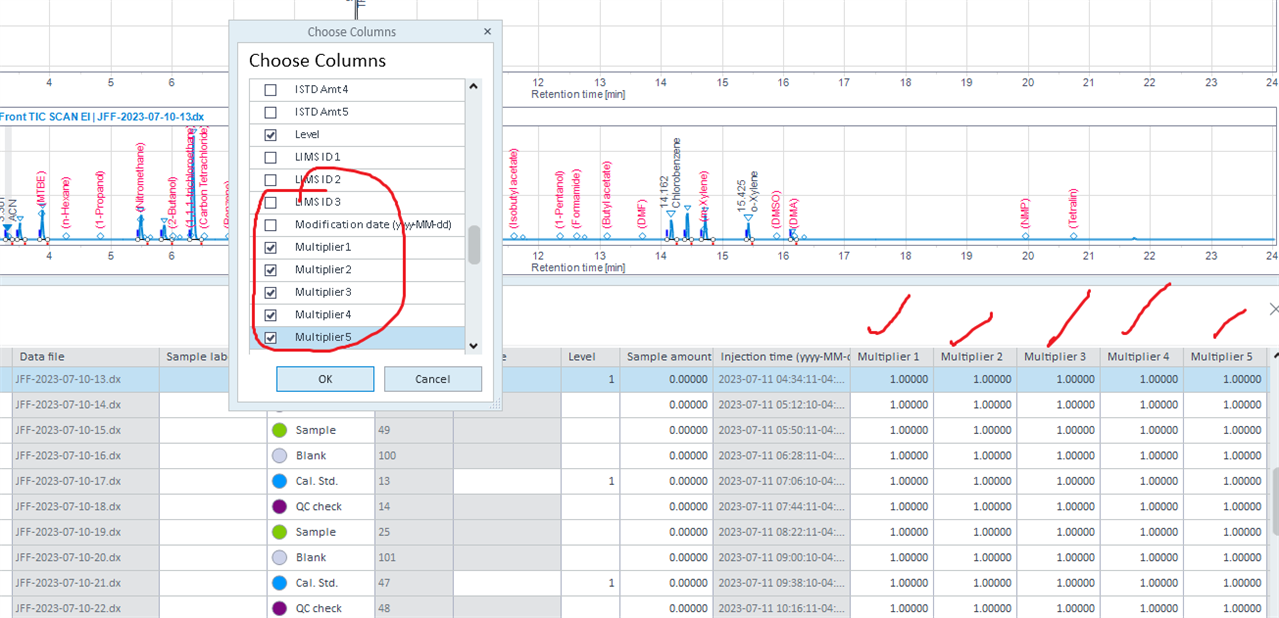
I am not sure what's wrong here.
I need to use the function related to the multiplier used in the process method.
Which multiplier is used in the concentration mass % ?

Based on my results, the multiplier need to be a 10 in order to give my result in ppm. It seems to work. I will do a test tomorrow addind another multiplier and check if my sample's results are affected.
If you add this to a sequence summary report, what it would do is show only the first injection or if they are in stacked mode it may show all injections at once on the same plot. If you change the sorting you can get a different order instead. What I expect you would want is for it to repeat for every injection. I don't know what you have it repeating on currently, if anything, but if it is already repeating on something, then you can simply put another group around it and set that to repeat by injection_ID, sorted by sample_OrderNo and Injection_AcquisitionOrderNo (to make sure it goes first to last injection).
Thank you for the advice. I appreciate that.
If you don't want it to show only one calibration point, then you need to filter it to show only the last calibration injection. What I've done to resolve this so far is in a different field go filter by sample type for only cal standards, sorted by sample_OrderNo, then store the last sample_orderNo. Then in another field go filter by Sample_OrderNo, sort by injection_AcquisitionOrderNo, then store the last Injection_AcquisitionOrderNo. Then in the calibration curve filter by the stored Sample_OrderNo and Injection_AcquisitionOrderNo. That should give you the calibration curve as of the last calibration injection. If you want to see how it works better, just repeat on injection_ID and you will see the calibration curve build up one point at a time.
Also, I think your response is by percent because you have either the "Normalize to" or "Calculate mass %" boxes checked in the calibration general settings. I've included a snip to show where they are. I recommend playing around with those to see your options. I haven't done much with them so I can't help much more than that.
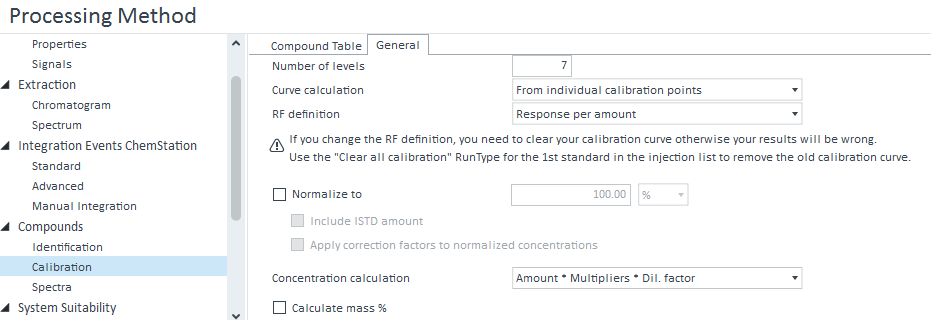
I need the % mass because the other option do not take into account the sample weight that I can put in my injection list for process.
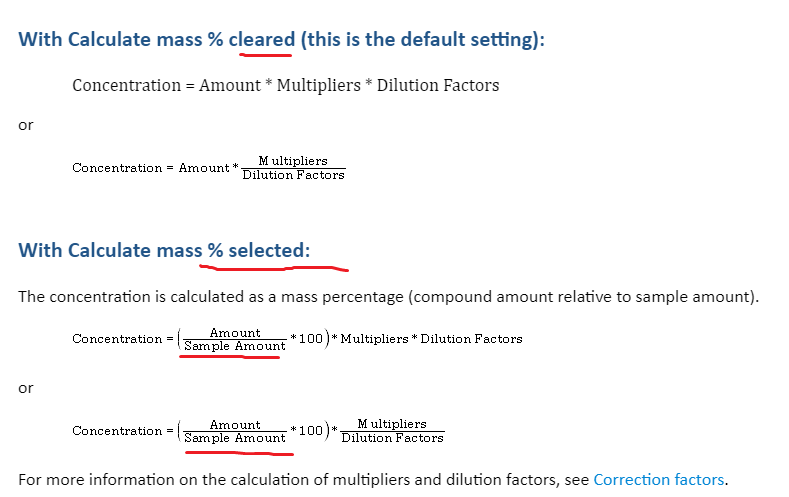
So the method will ask to the analyst to put sample weight in mg in the injection list. The concentration will be the amount founded by the one point curve (limit test) in ug divided by sample weight. I need to add multiplier to transform mg of sample into gram. The conversion scale is 1000 but since I already multiplied by 100, I have to add a 10 fold multiplier.
And it works perfectly. I can show the concentration calculated like that in ppm (ug solvant/g of sample)

9.84 ug founded with my one point curve is then divided by the sample weight 25 mg gives 0.3936 ug/mg. In order to transform it into PPM (ug/g) we need to multipliy by 1000. 394 ppm and that's what we obtained. So the calculation is perfect without doing any custom calculation. Very simple.
But the problem is that I can't show my multiplier used in my sequence table into the sequence summary table in my report for our data revisor.
Also, by choosing this % mass, my response axis is in % amount based on calibration point. I can live with that if we can't change it to raw unit counts.
But I need to find a way to show my multiplier factor in my sequence table.
Hello,
All the multipliers are used in the concentration calculation. The multiplier in the method is the compound multiplier which is different from the sample multipliers 1-5. The compound multipliers can be different for each compound in the peak table but are the same for all injections. The sample multipliers are applied to all results for a given injection but can be different for each injection
Marty.
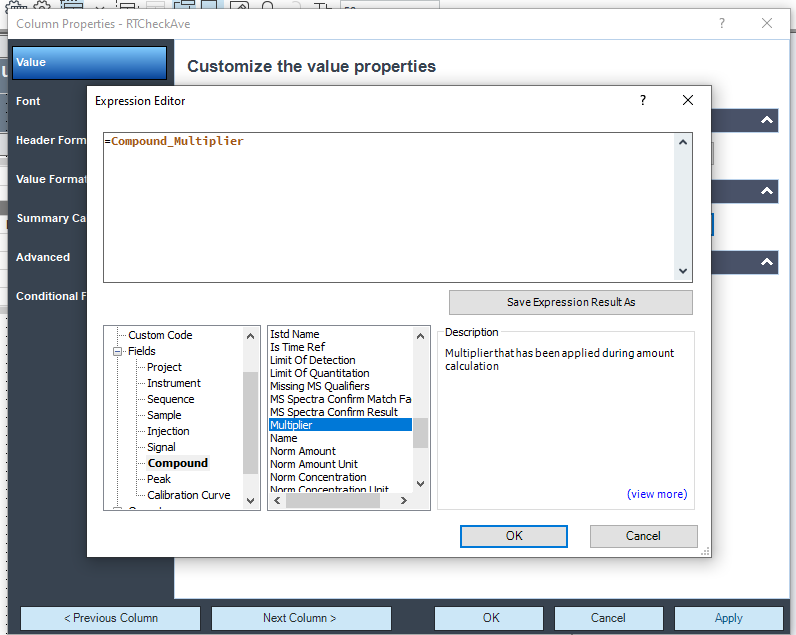

It's weird because I don't have this option on my side. No Multiplier.
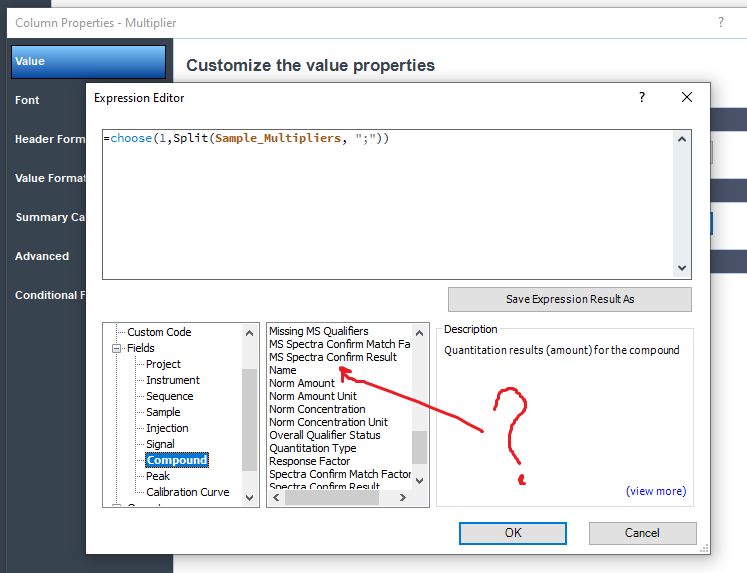
In my version, that field isn't available. However, he can get it by the calculation =Compound_Concentration/Compound_Amount
I don't have the multiplier field either on my openlab CDS 2.6.
I don't understand your calculation to retrieve my multiplier of 10.
if I use your equation with my first example it will be :
393.60 ug/g divided 9.84 = 40. It doesn't work. it's supposed to be 10.
Does it return exactly 40? If you pump up the number of decimals is it 40.000000000? If so, then it's probably using one or multiple values you entered somewhere, which would allow you to modify the calculation to account for that. At least on my end it just spits out the multiplier, but I also doubt I have all the same stuff filled out as you do.
Did you enter a 4 somewhere? Or a 0.25?
My equation is :
ug solvant/g samples= amount/sample weight (mg) * 100 *10
In bold view, this is calculated with the % mass formula. the multiplier 10 is the one I want to show on my sequence table summary.
Try the calculation I stated above in the software and let me know what it returns. I can't really help unless I know what it returns. If you do calculations by hand, there is no guarantee you're doing the same calculation as the software would. If it returns exactly 40 when put into the software, then look around in your other entered fields for 4 or 0.25. I expect it would be in the multipliers or dilution factors.