Display grouped peak summary in sequence summary reports

Hello, I believe this has been asked like a dozen times, however I cannot for the life of me get the proposed fixes to work for my situation. 

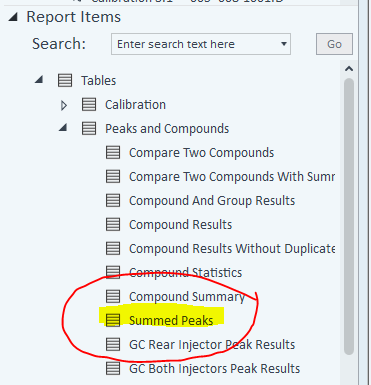
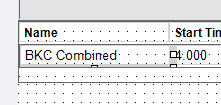
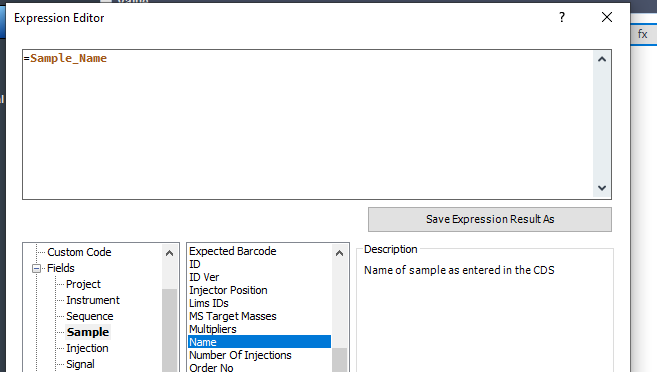
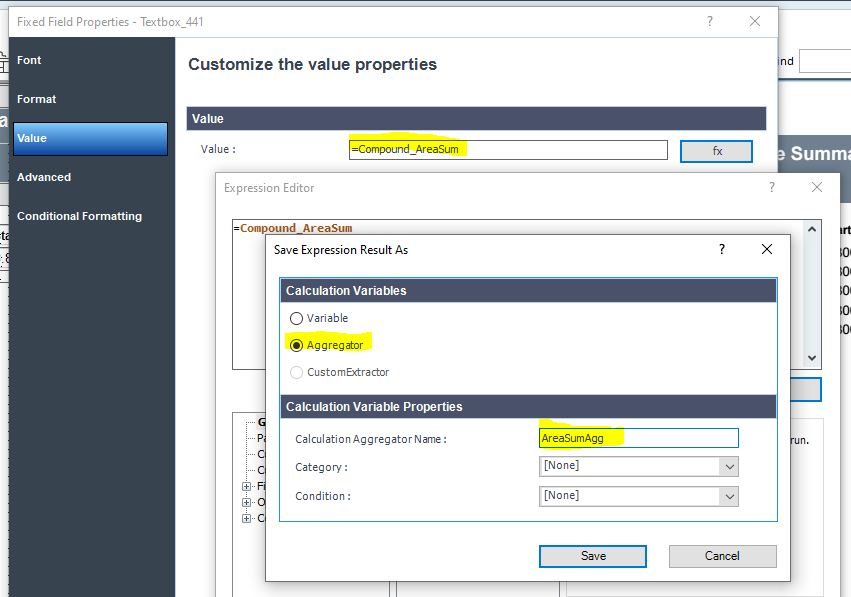
Simple enough, I want to quantify my recovery of Benzalkonium Chloride, (BKC). BKC has typically 2 or 3 peaks. THe sum of the areas is used in quantitation. How do I set up a report to 

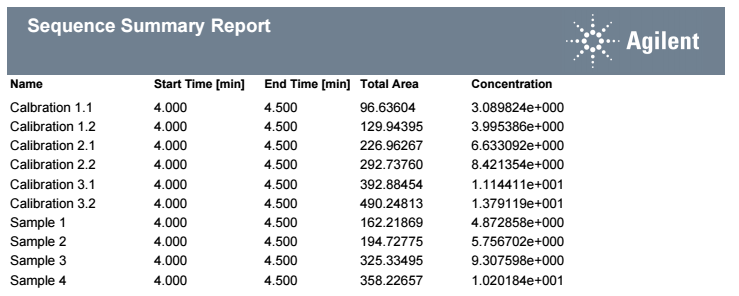
1) Display the summed areas of the peaks. 

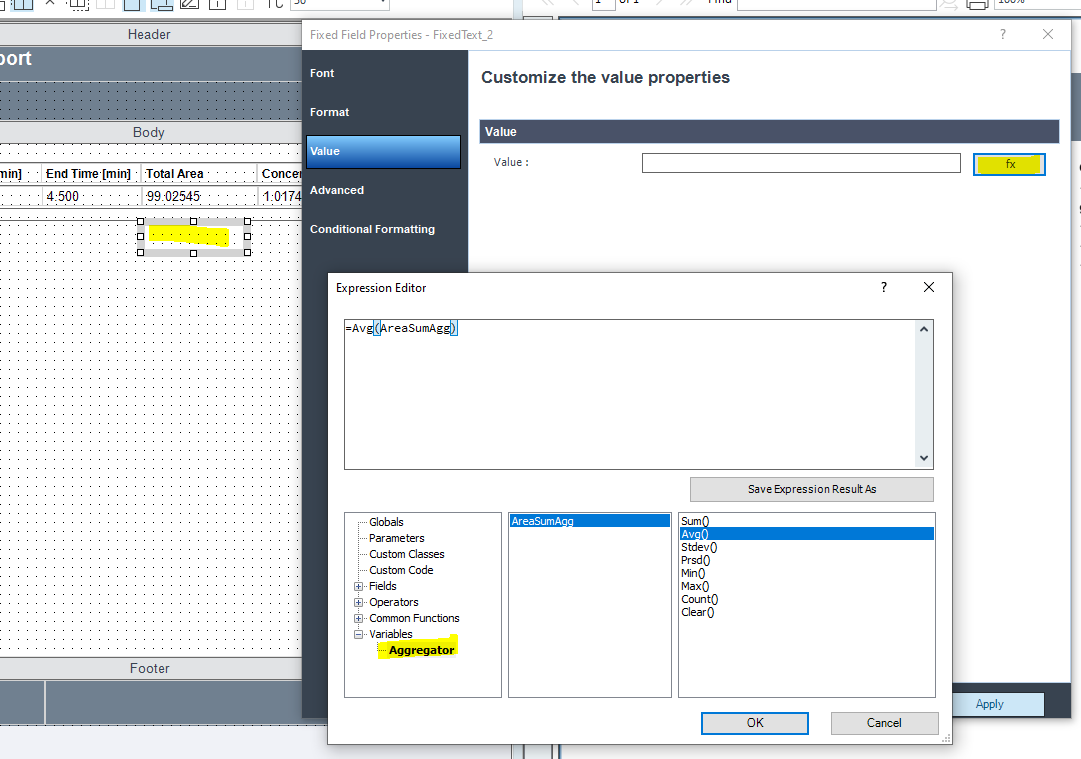
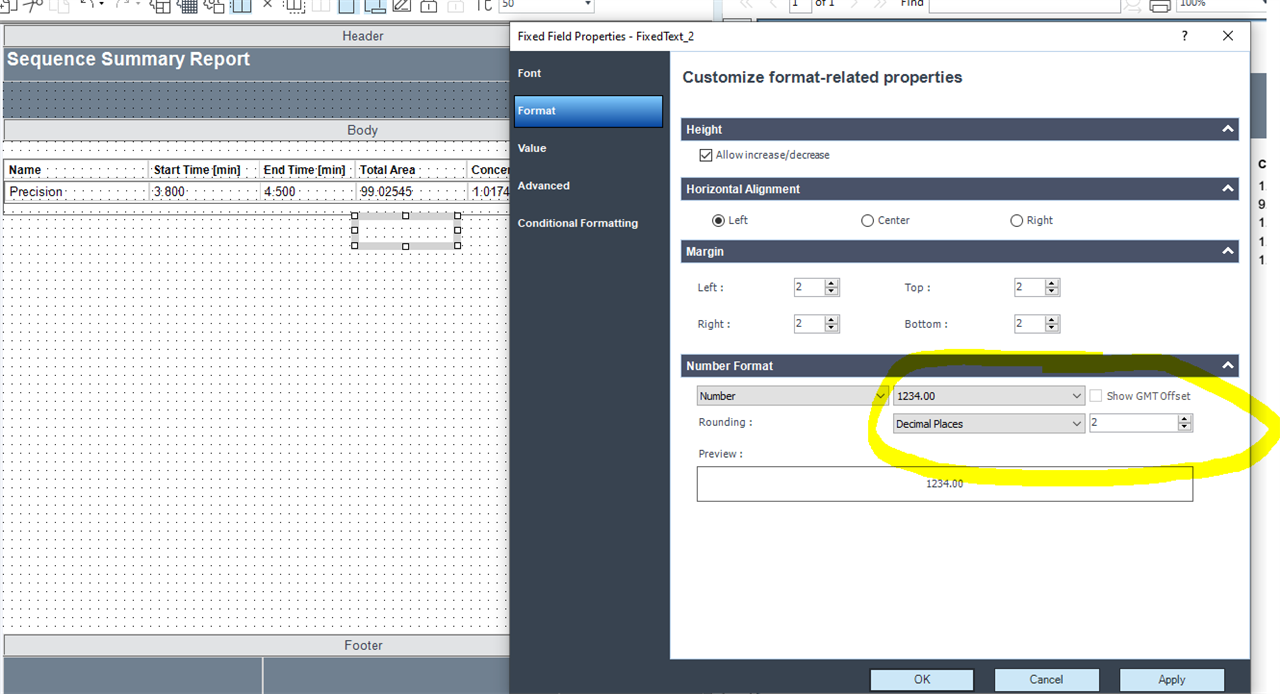
2) Perform statistics on the achieved results and display these results on a report. (I have been using Short sequence summary report) 

Any assistance is appreciated. 

Bob. 

Parents Reply
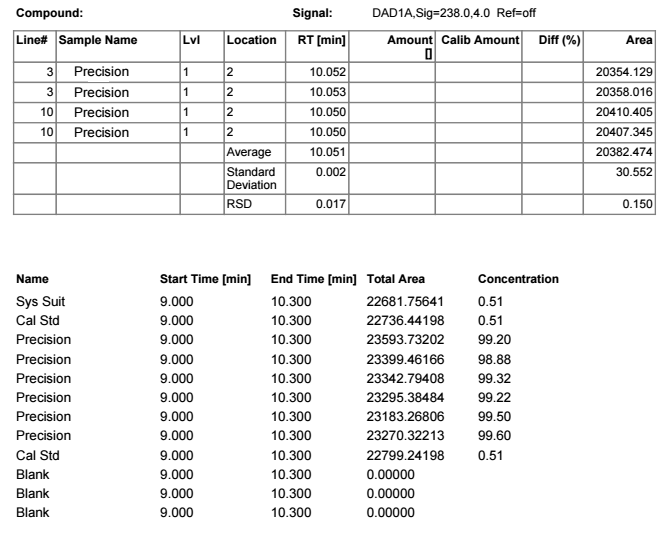
  • Andy, Thank you for the help with this table. I do have an additional request if that is possible? I can now display the calculated results of the combined peaks and that works fine. However is there a way to display this information in a traditional sample table (first table below)? Please see pics below. The screenshot is a typical table for a compound. This is how I would like the combined data to display, If possible can you provide the steps for this activity. Also, how do I display only the sample statistics and not blanks ,sys suit, or cal stds? 

Children
Was this helpful?