Display grouped peak summary in sequence summary reports

Hello, I believe this has been asked like a dozen times, however I cannot for the life of me get the proposed fixes to work for my situation. 

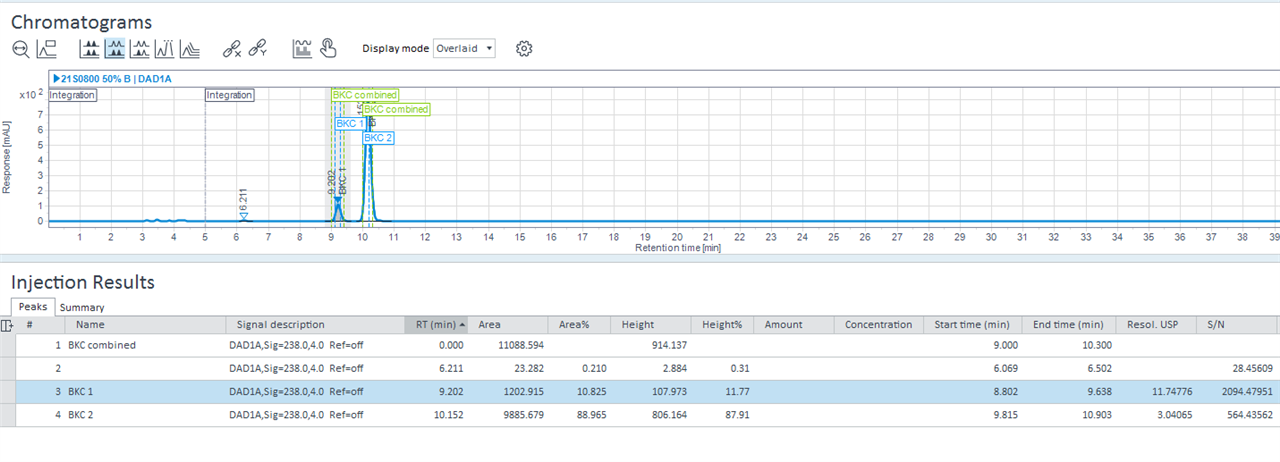
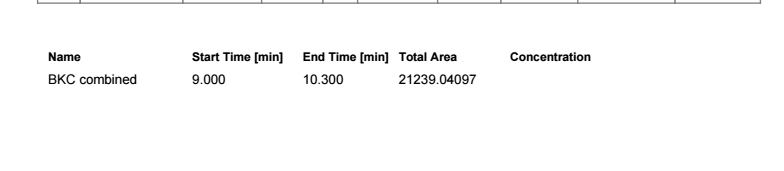
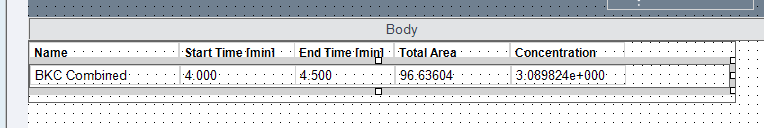
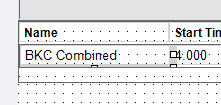
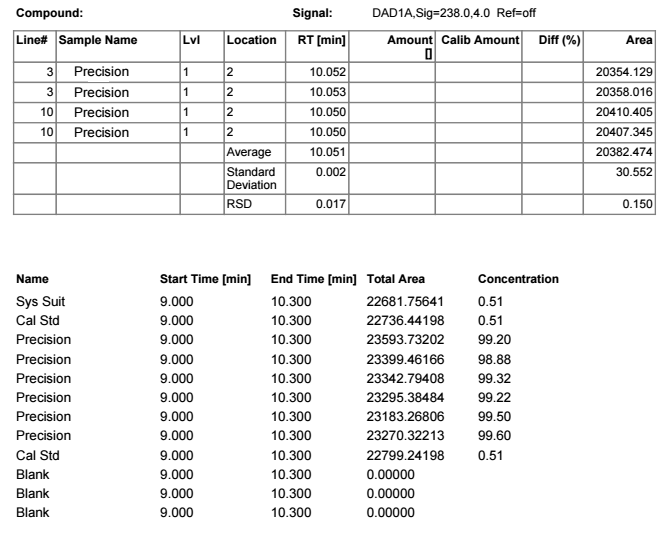
Simple enough, I want to quantify my recovery of Benzalkonium Chloride, (BKC). BKC has typically 2 or 3 peaks. THe sum of the areas is used in quantitation. How do I set up a report to 

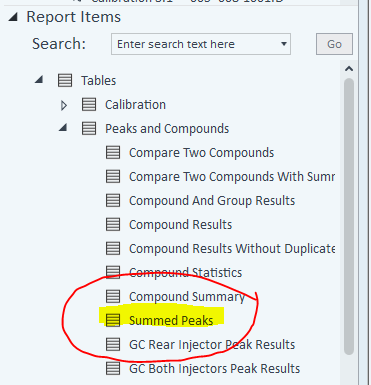
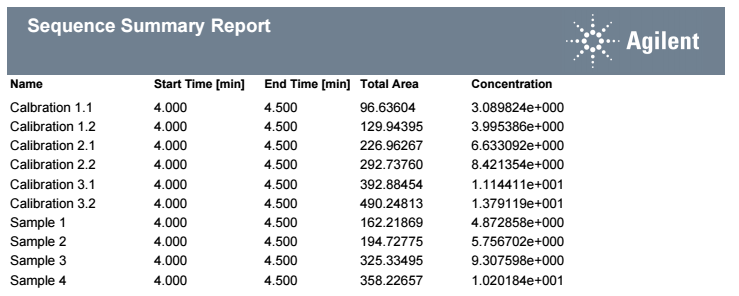
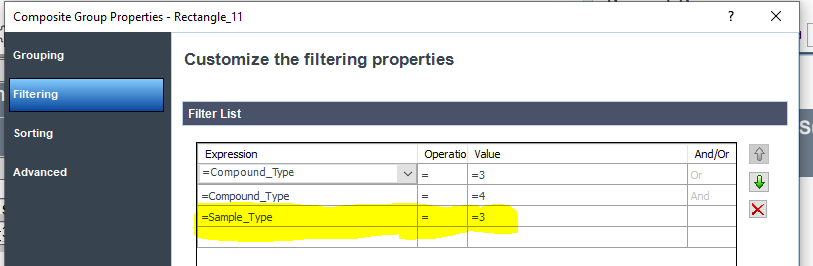
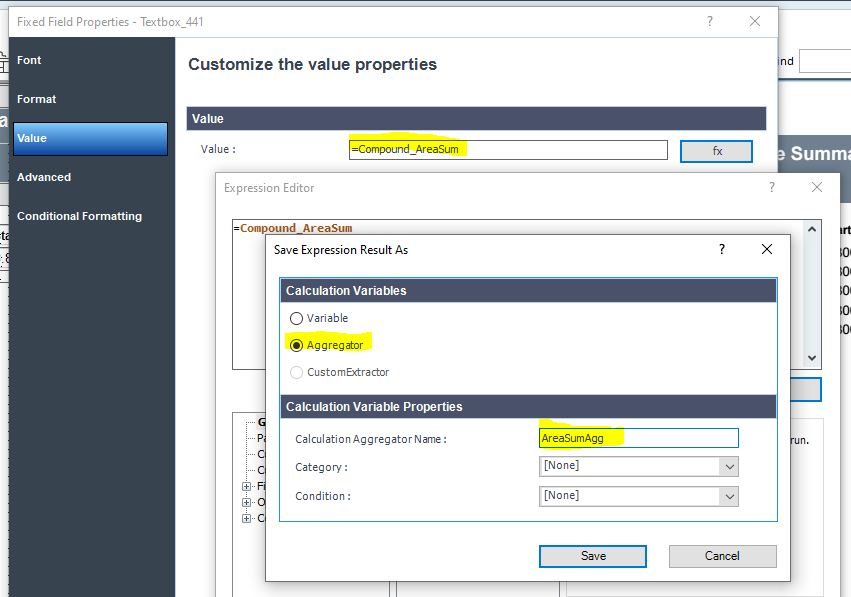
1) Display the summed areas of the peaks. 

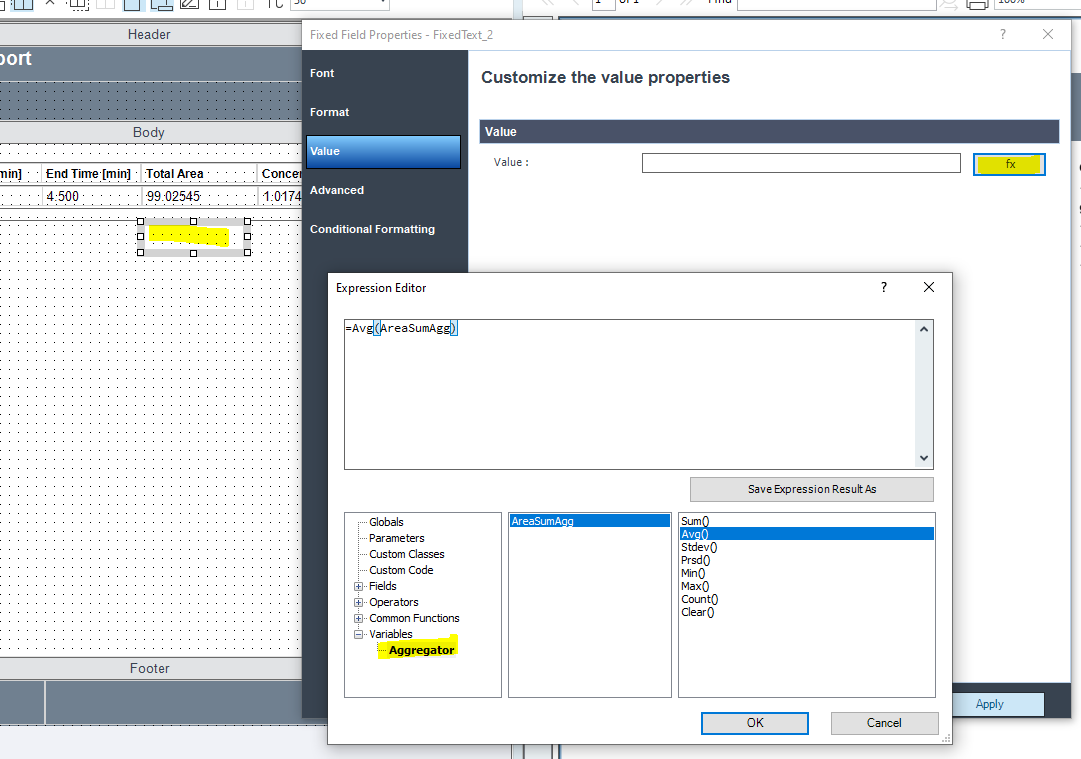
2) Perform statistics on the achieved results and display these results on a report. (I have been using Short sequence summary report) 

Any assistance is appreciated. 

Bob. 

Parents Reply Children
  • Hi Bob

    In the report template, you need to add a "Summed Peaks" table

    /Andy

  • Andy,  Thank you for the help. I took the default "Sequencesummary_short_letter.rdl and added this table to that report. (at the bottom) I get only 

    How do I get this to report all of the samples that were run? Sorry very new to this. 

  • You're right, this report item is designed for a single injection report.

    To change it is a little complicated, but I will try to help.  It is simplest if you only have one Timed Group.

    Select the group containing the data

    Right-click to see its properties

    You will see that the group is repeated for each Compound_ID.

    Change this to repeat for each Sample_ID

    Now you need to change the textbox that currently shows Compound_Name to show Sample_Name

    Right-click to access the properties of this text box

    Click on the fx button to select Sample_Name instead of Compound_Name

    Make sure you have all of the samples selected and preview the report.  You should get something like this (I'm using example data here)

    Hope that helps.

    /Andy

  • Andy, Thank you I was able to follow your directions and I am now able to recreate this table. Thank you. I will now "attempt" to format the table so it appears like the other default tables that Agilent uses. Thank you again! I am sure I will be back with more ?'s 

  • Andy, Thank you for the help with this table. I do have an additional request if that is possible? I can now display the calculated results of the combined peaks and that works fine. However is there a way to display this information in a traditional sample table (first table below)? Please see pics below. The screenshot is a typical table for a compound. This is how I would like the combined data to display, If possible can you provide the steps for this activity. Also, how do I display only the sample statistics and not blanks ,sys suit, or cal stds? 

  • Hi Bob

    I'm not convinced that you can put this in a conventional table.  You might be able to add borders to the textboxes that make up this report item.

    Applying a filter to the group that repeats the information for each injection that selects only samples

    Sample_Type  =  3

    would remove the blanks etc

    Sample statistics is a little more complicated!

    If you want to get the mean/sd/rsd you need to use an aggregator variable.

    In the screenshots below, I'm doing this for the textbox containing the area sum

    Once this is done, you can place textboxes below the table and display some of the stats you want below the "table"

    Don't forget to set the numeric precision as appropriate for these text boxes!

    Hope that all helps!

    Andy

Was this helpful?