Display grouped peak summary in sequence summary reports

Hello, I believe this has been asked like a dozen times, however I cannot for the life of me get the proposed fixes to work for my situation. 

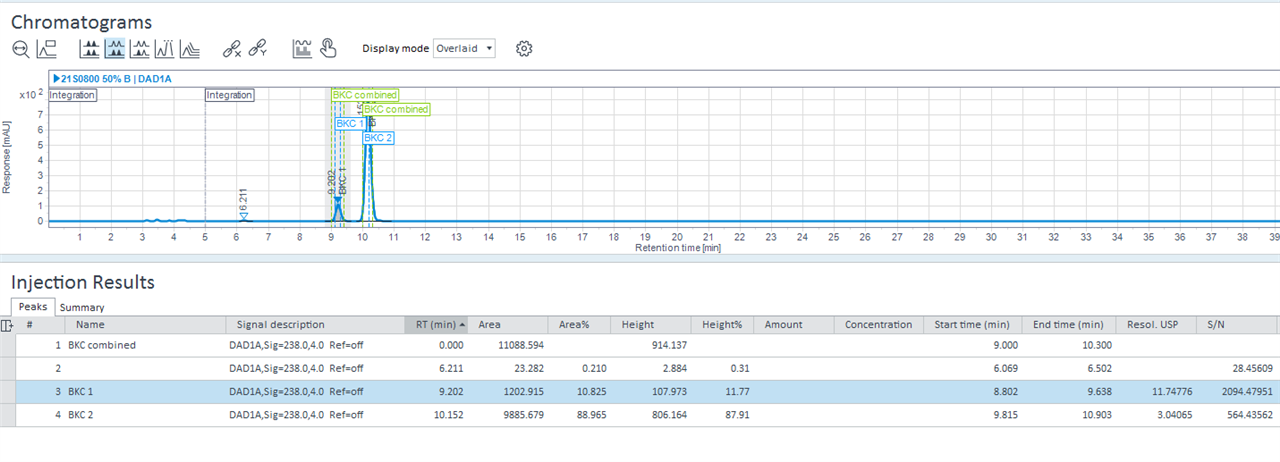
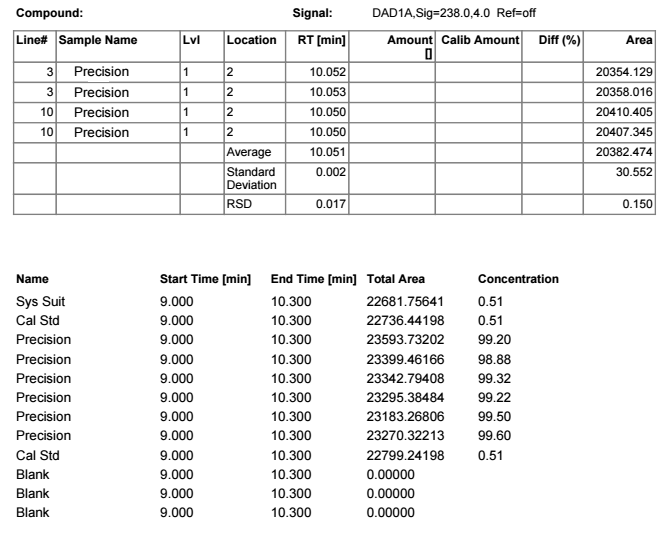
Simple enough, I want to quantify my recovery of Benzalkonium Chloride, (BKC). BKC has typically 2 or 3 peaks. THe sum of the areas is used in quantitation. How do I set up a report to 

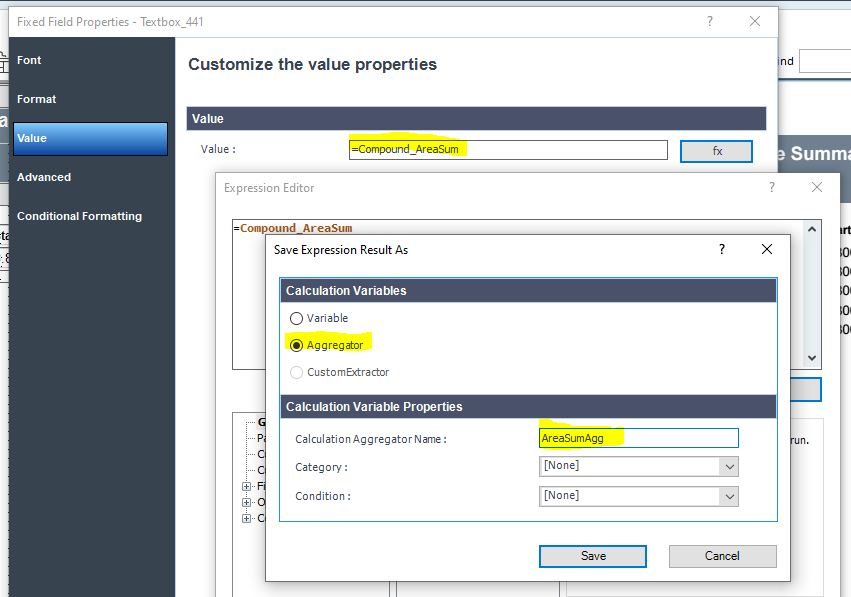
1) Display the summed areas of the peaks. 

2) Perform statistics on the achieved results and display these results on a report. (I have been using Short sequence summary report) 

Any assistance is appreciated. 

Bob. 

Parents Reply
  • You're right, this report item is designed for a single injection report.

    To change it is a little complicated, but I will try to help.  It is simplest if you only have one Timed Group.

    Select the group containing the data

    Right-click to see its properties

    You will see that the group is repeated for each Compound_ID.

    Change this to repeat for each Sample_ID

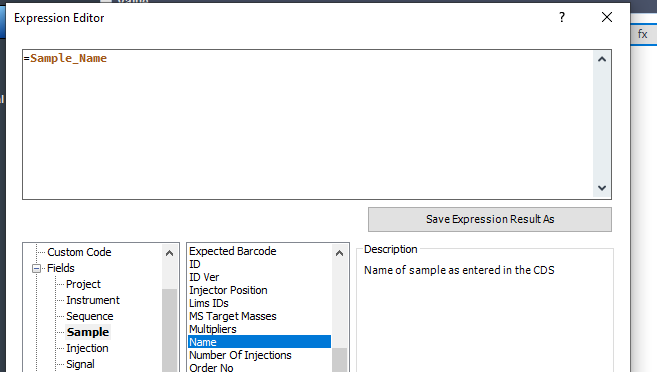
    Now you need to change the textbox that currently shows Compound_Name to show Sample_Name

    Right-click to access the properties of this text box

    Click on the fx button to select Sample_Name instead of Compound_Name

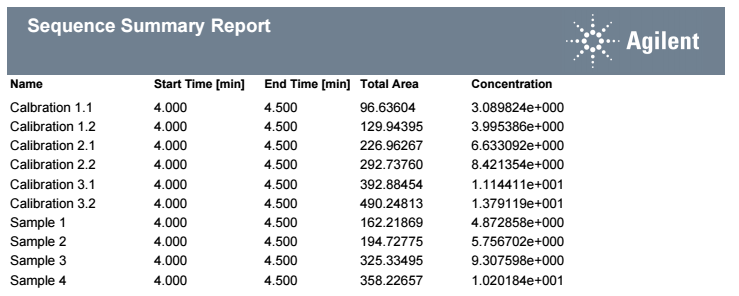
    Make sure you have all of the samples selected and preview the report.  You should get something like this (I'm using example data here)

    Hope that helps.

    /Andy

Children
Was this helpful?