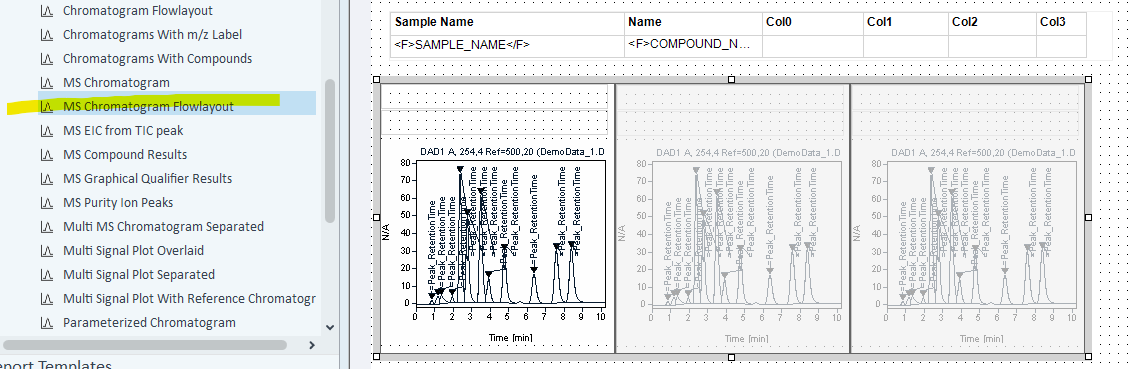
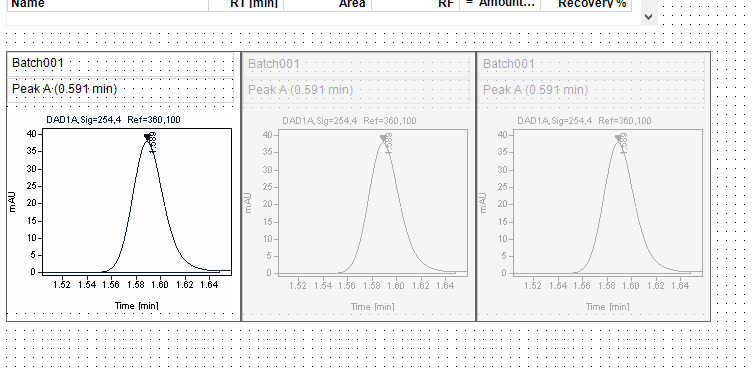
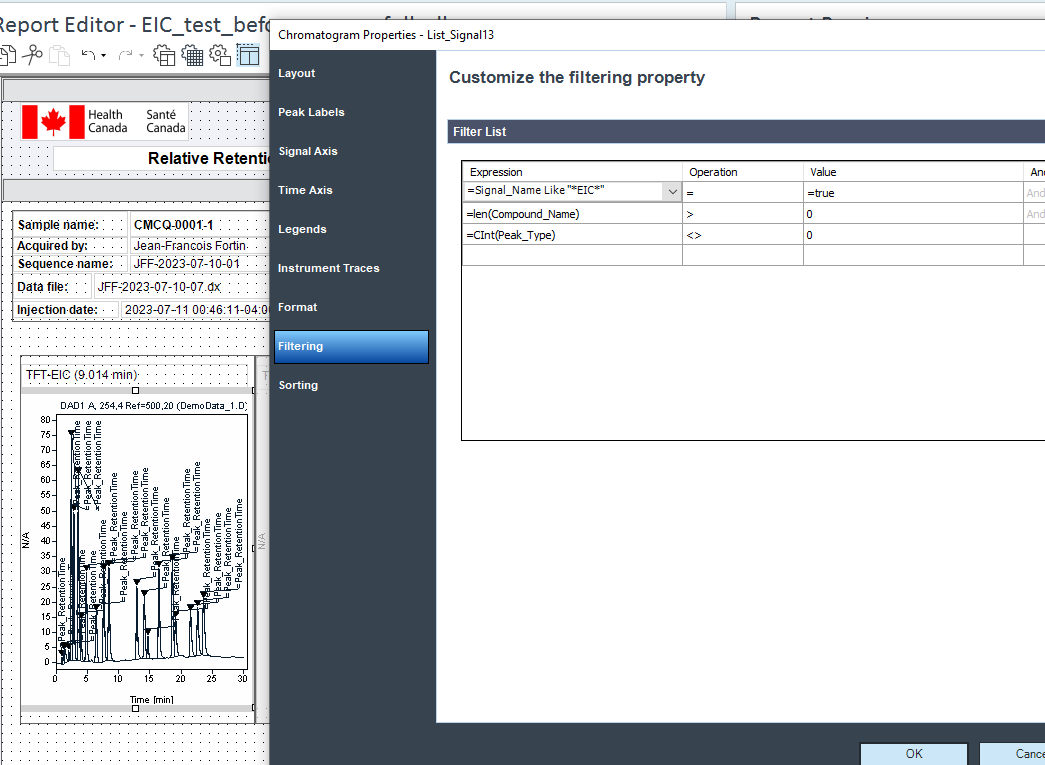
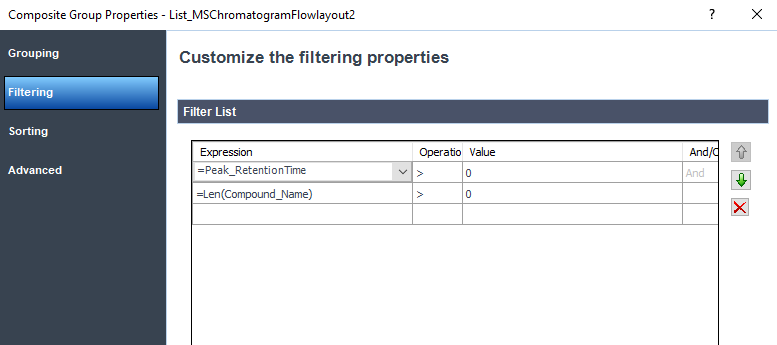
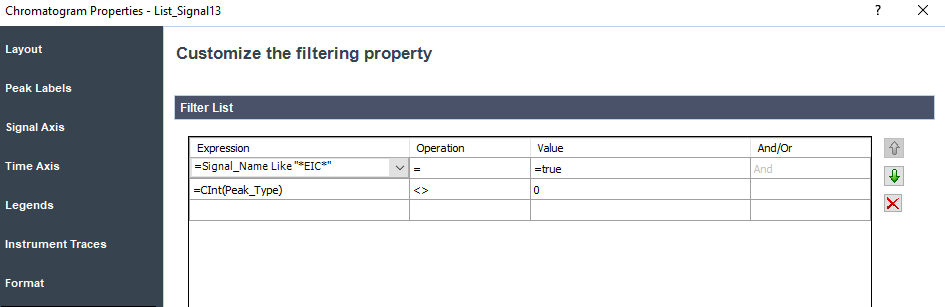
I tried to copy EIC Signal description items near each other and I don't know how to avoid this problem showed below.
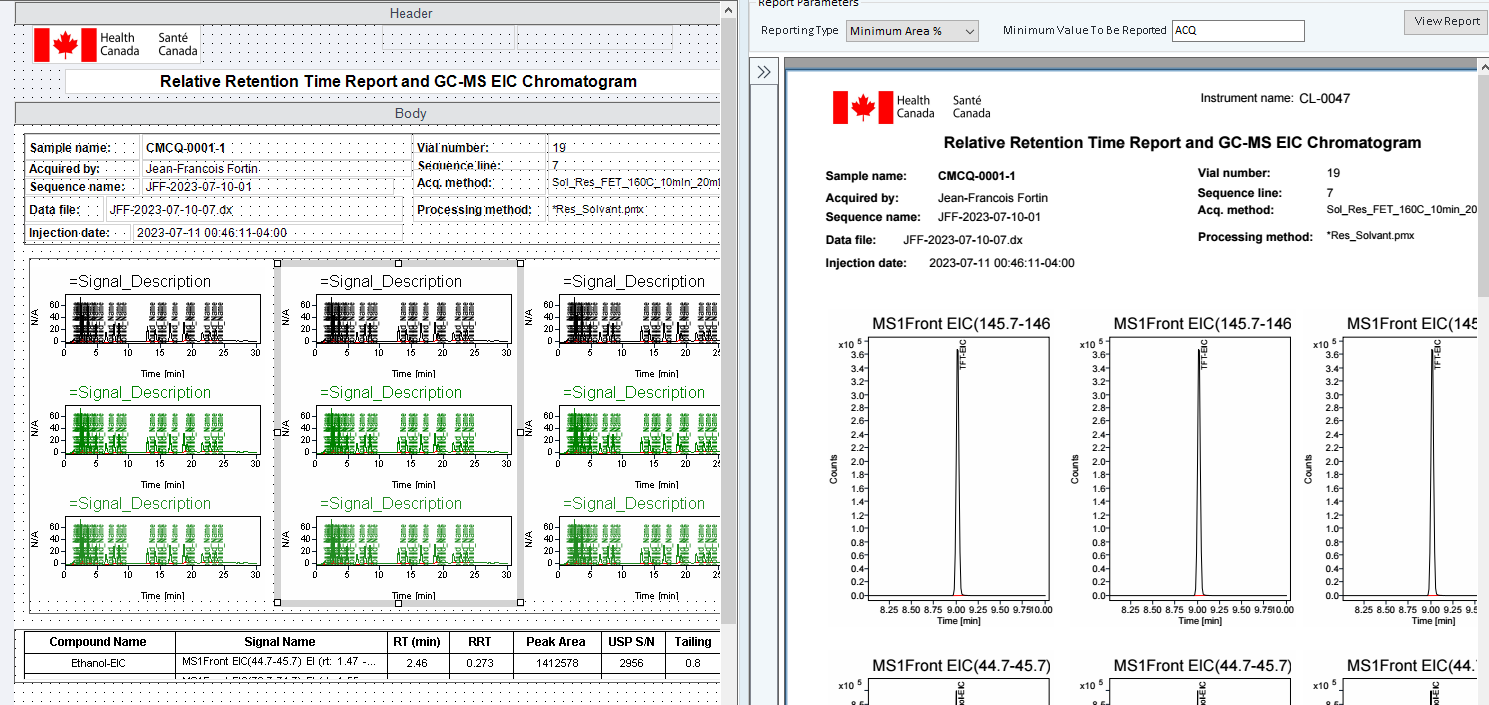
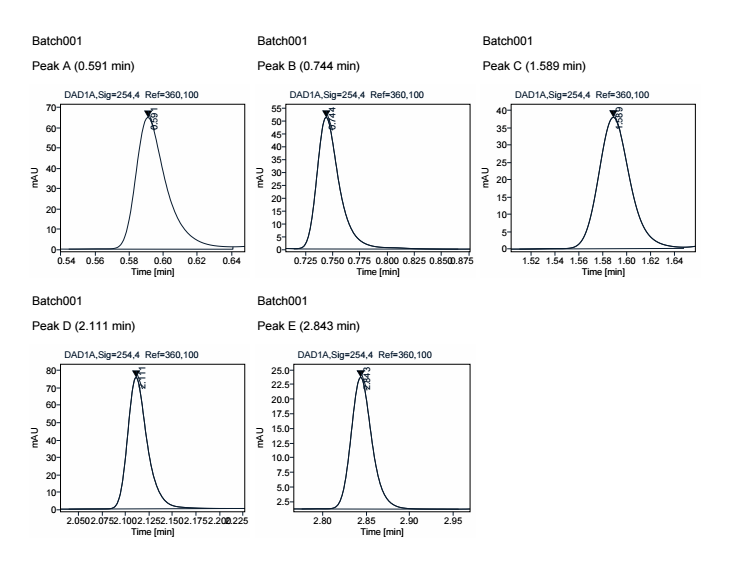
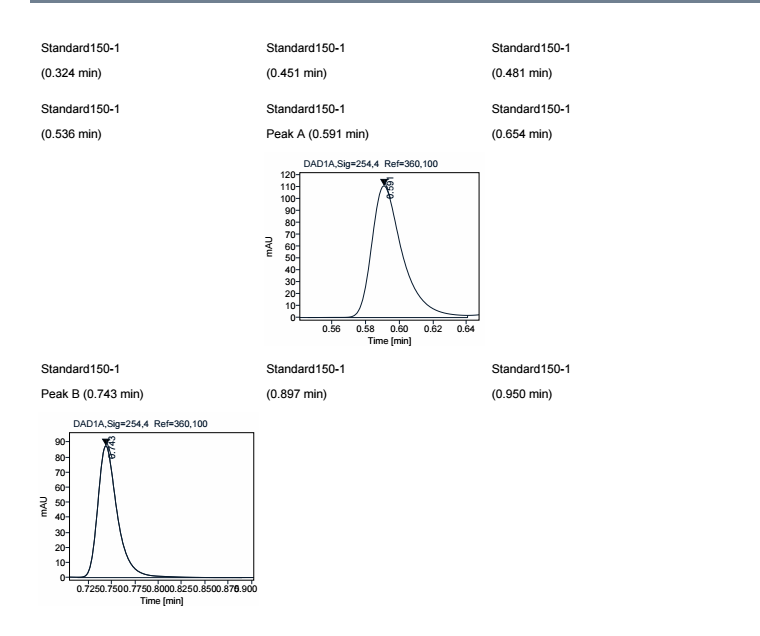
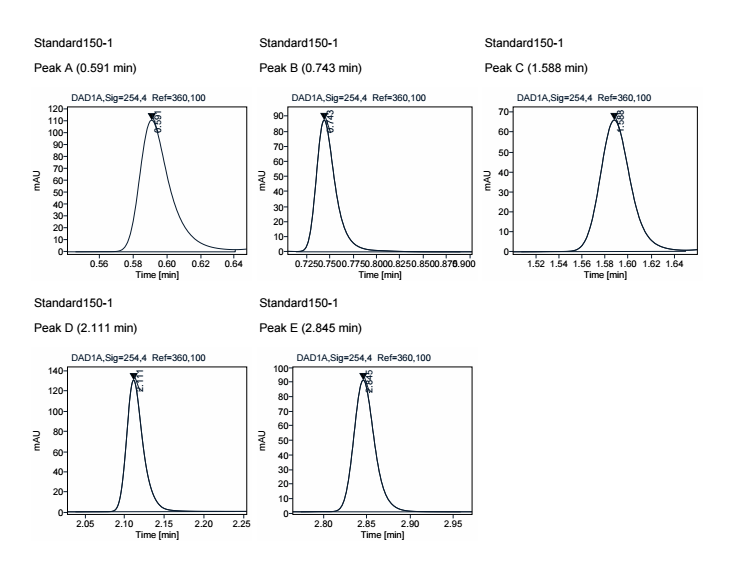
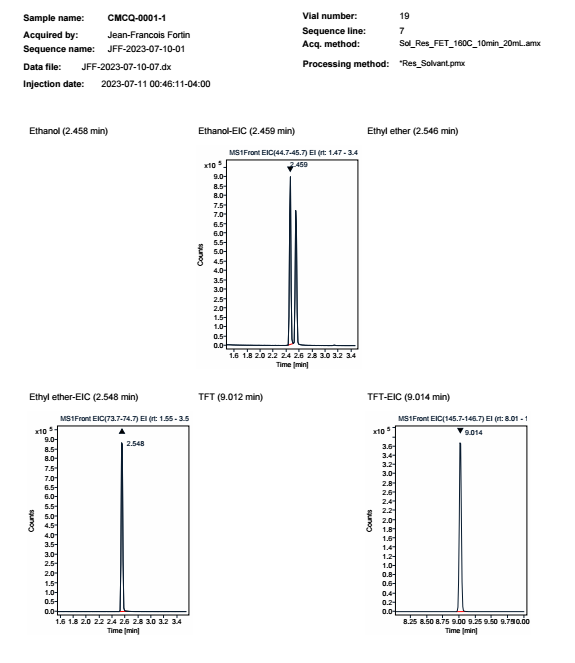
As you can see, the three chromatogram is the same compound. How can I avoid this repetition?
thank you for your help.
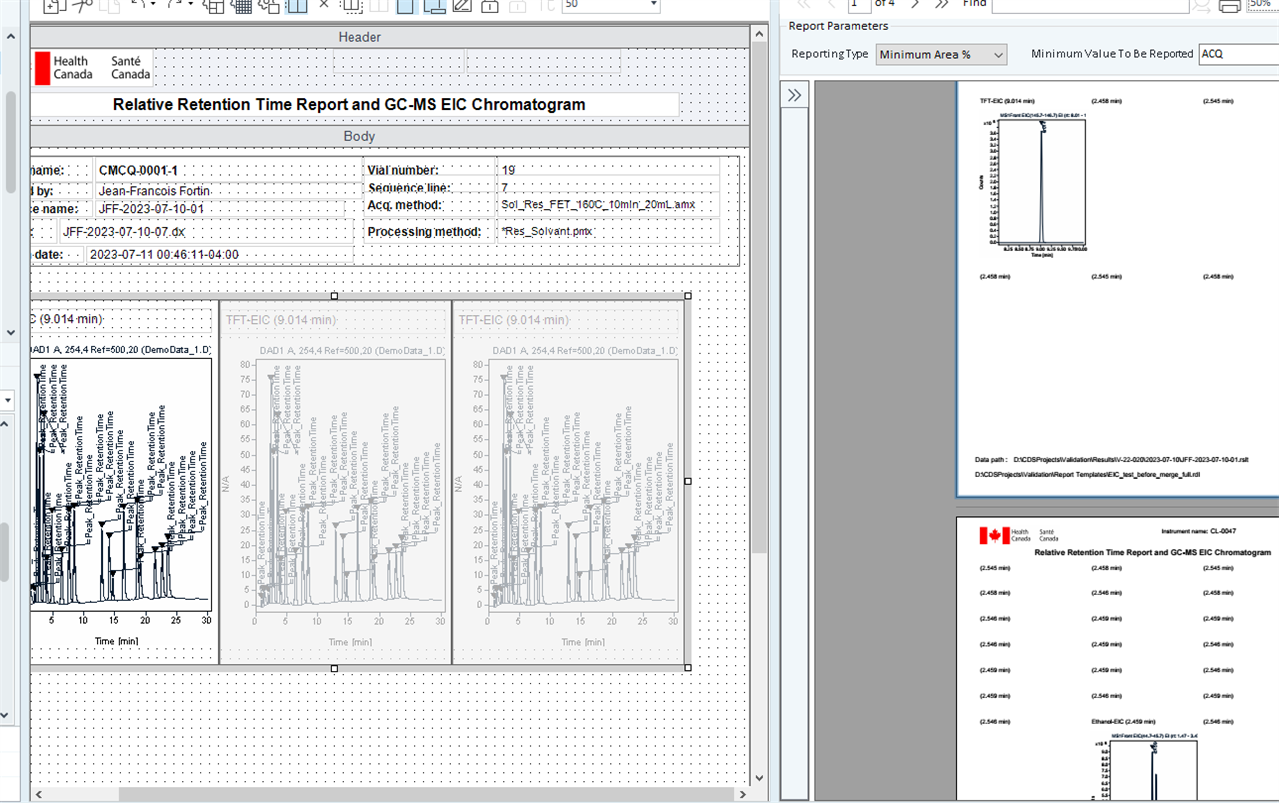
I tried to copy EIC Signal description items near each other and I don't know how to avoid this problem showed below.
As you can see, the three chromatogram is the same compound. How can I avoid this repetition?
thank you for your help.