I tried to copy EIC Signal description items near each other and I don't know how to avoid this problem showed below.
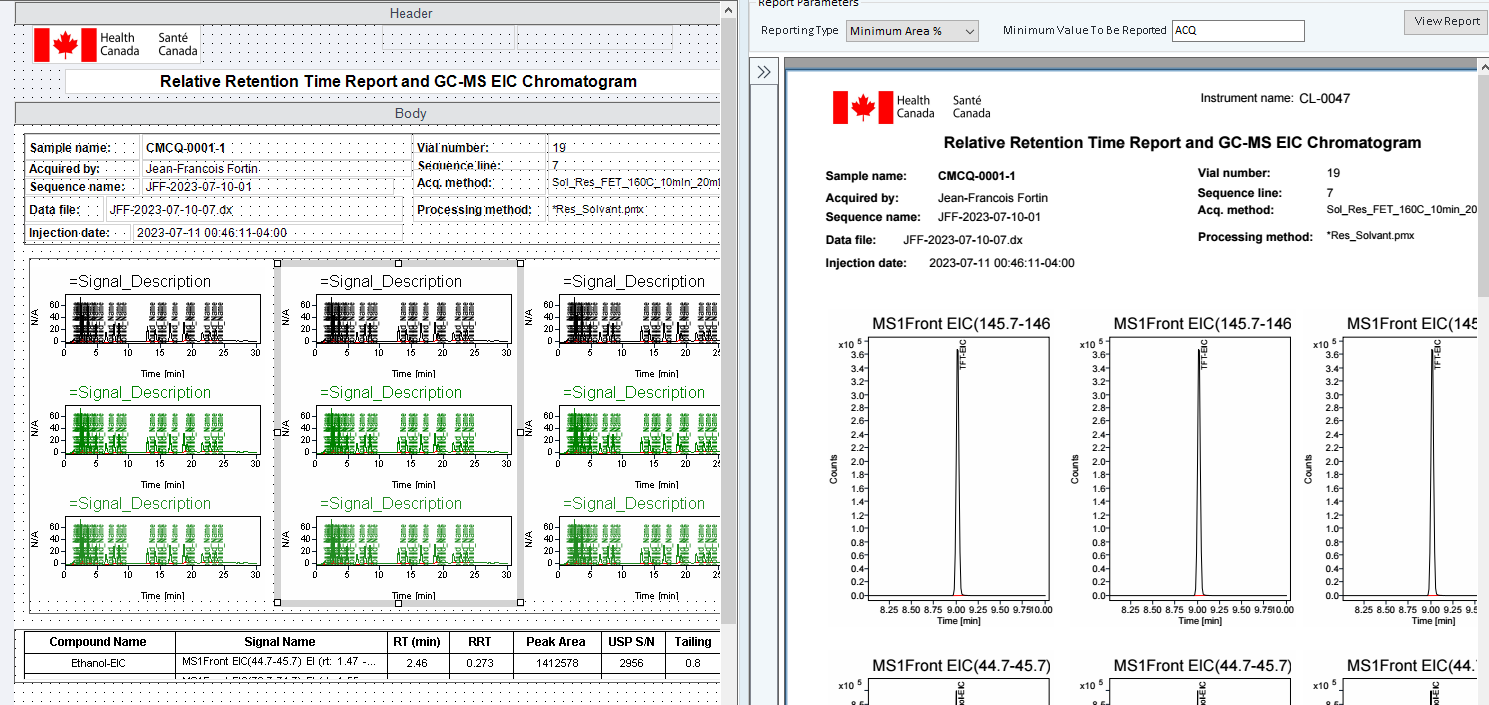
As you can see, the three chromatogram is the same compound. How can I avoid this repetition?
thank you for your help.
I tried to copy EIC Signal description items near each other and I don't know how to avoid this problem showed below.

As you can see, the three chromatogram is the same compound. How can I avoid this repetition?
thank you for your help.
Hello,
Try the MS Chromatogram Flowlayout object instead of the individual chromatograms.
Marty

Hi Martin. I have the same problem. I don't know how to manage the group repeating so we can have different compound name on chromatogram lighted in gray.
Hello,
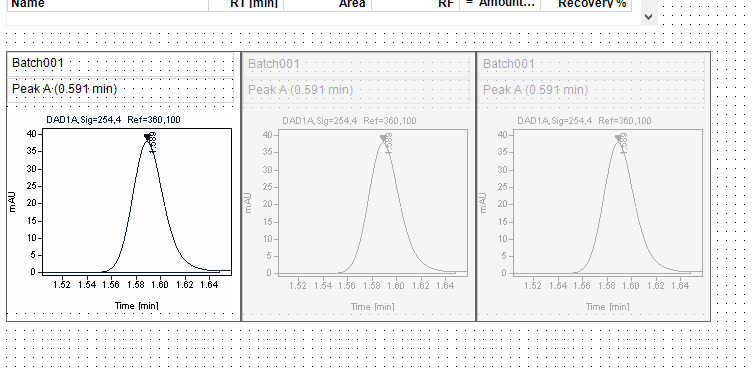
Did you actually preview the report? Maybe I am not understanding what you are trying to do in the report. In the example below, the object shows the same peak in each internal repetition object but when you actually render the report it repeats the object 3 across by default for every peak in the chromatogram in RT order. You can add filters to only show named peaks or other types but that is how that object works. Also note it does not automatically repeat by injection so if this is a summary report the peaks will be displayed together by RT and I think sample name or type. You can control this by grouping the object and repeating on an outside group.
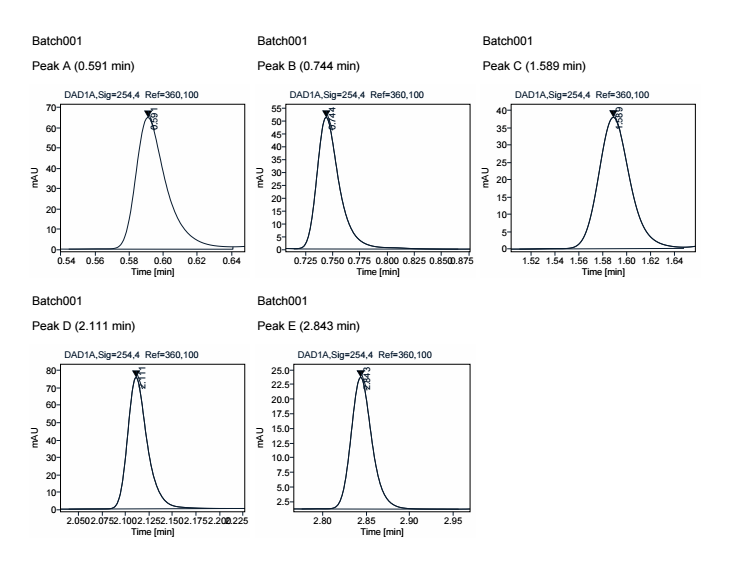
Your example is exactly what I want, 3 peaks by column on the same injection.
For some reason, I can't mix like compound name (or in your case, Peak A to E).
In my example, I have 3 expected compound in my injection. Ethanol, ether and TFT. I want the report to show only the 3 EIC of each compound related to the calibration table.
I want the report to show it exactly like your example Peak A, B and C. 3 columns.
I don't know how to do that. Right now, I have this result:
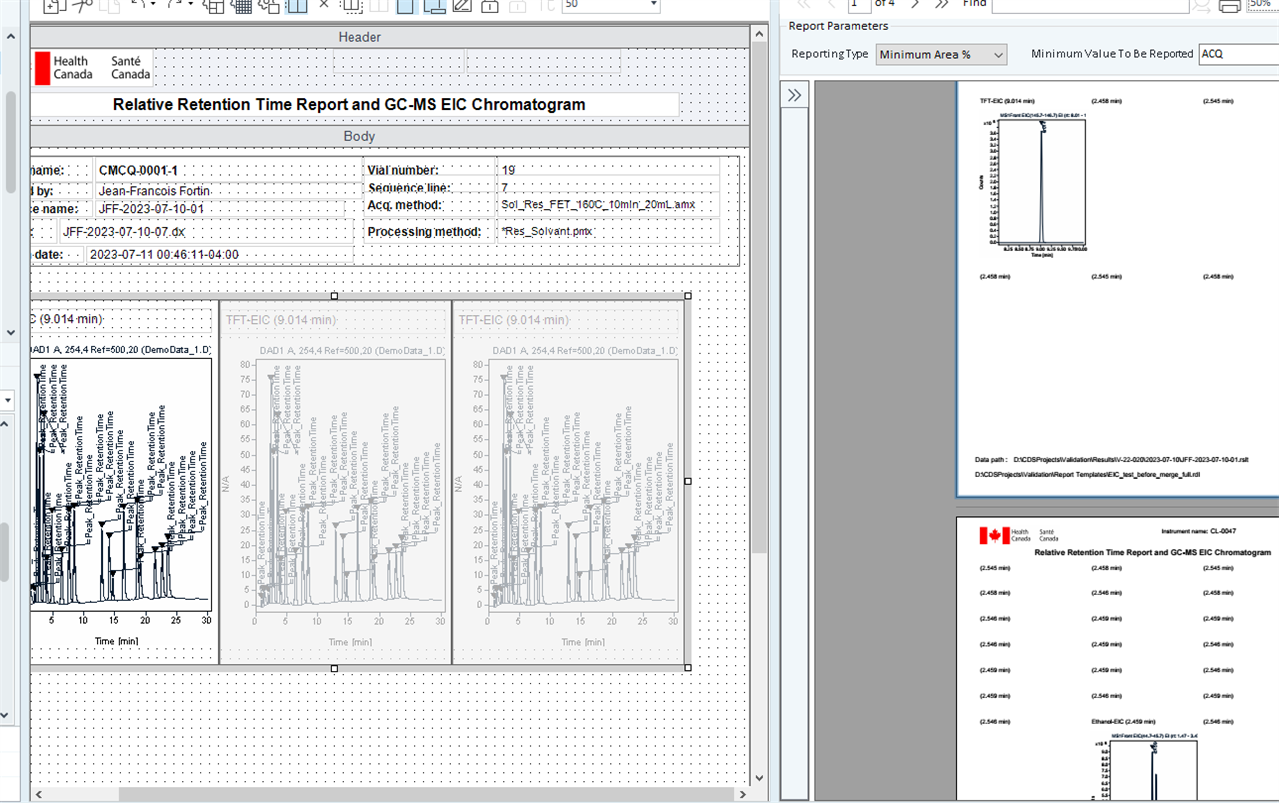
Overall, I can see those 3 EIC Compound peak, but I have several blank space with unknonw retention between them.
My filter is surely wrong here.
Your example is exactly what I want, 3 peaks by column on the same injection.
For some reason, I can't mix like compound name (or in your case, Peak A to E).
In my example, I have 3 expected compound in my injection. Ethanol, ether and TFT. I want the report to show only the 3 EIC of each compound related to the calibration table.
I want the report to show it exactly like your example Peak A, B and C. 3 columns.
I don't know how to do that. Right now, I have this result:

Overall, I can see those 3 EIC Compound peak, but I have several blank space with unknonw retention between them.
My filter is surely wrong here.
Right now it's a single injection report template but I will eventually need to export it into a summary sequence template.
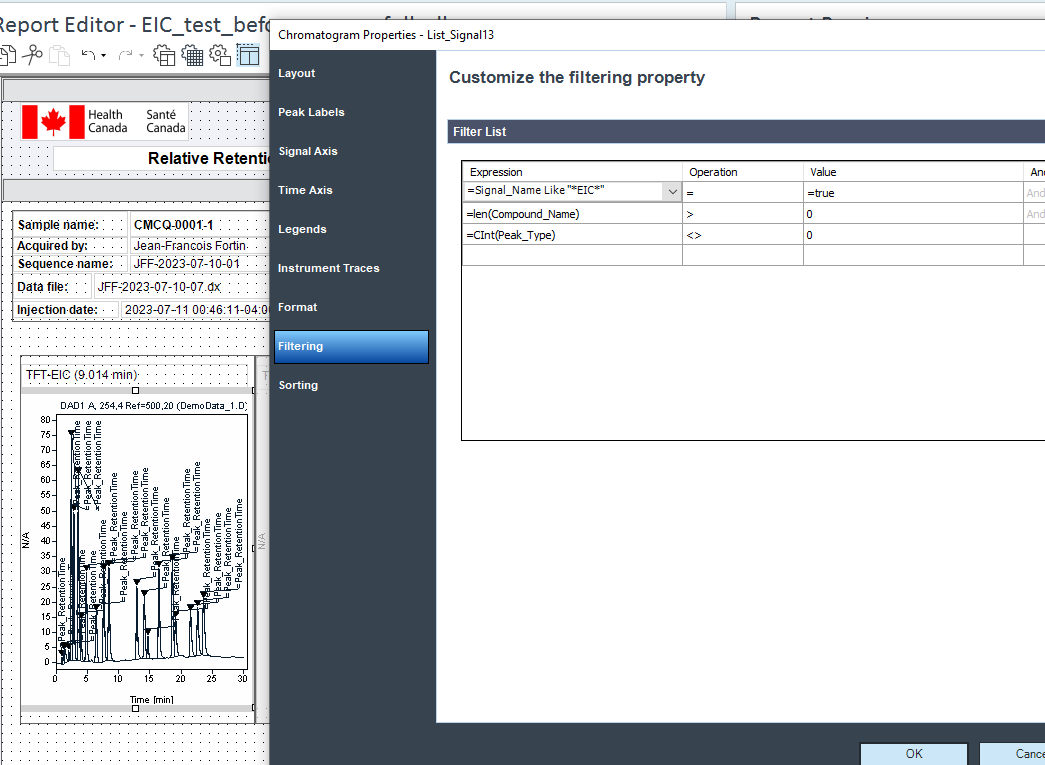
I did have this filter as for now.
Hello,
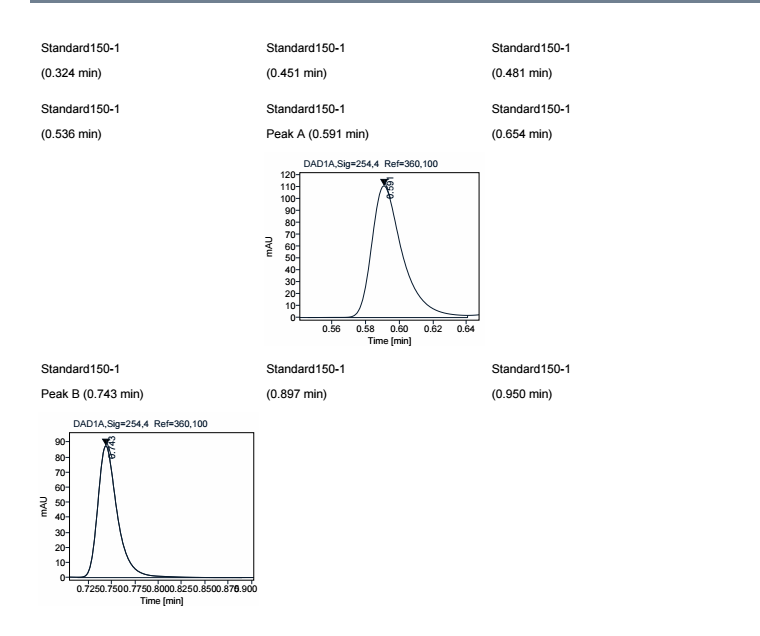
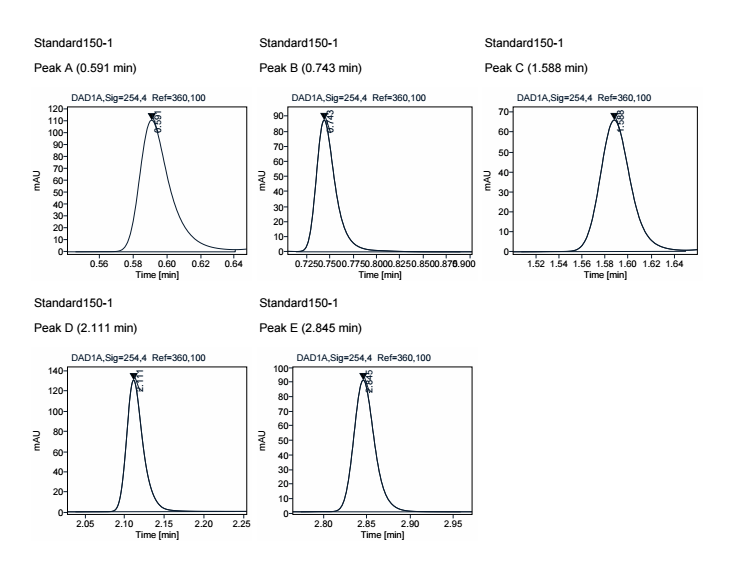
It looks like your filter is on the chromatogram object not the outside group. See the example below where I added Len(compound_name) > 0 as a filter in both locations.
Filter on the Chromatogram object
Filter on the group object
Oh Perfect, I will try this. Thank you again for your precious help.
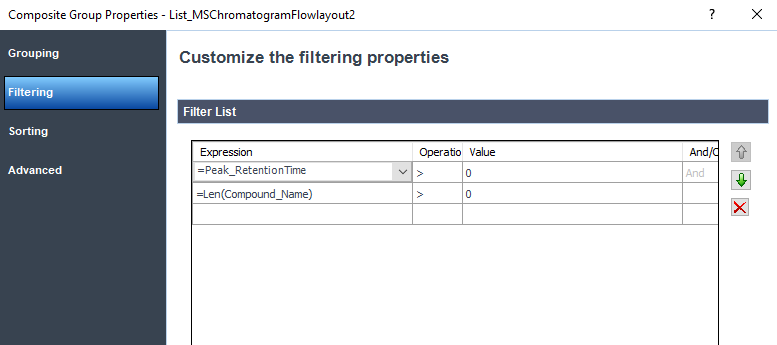
Ok I tried to put my filter on the outside group. It's getting better but not completely OK.
Here is the outside filter performed with a sorting based on Peak retention time :
I erase the Len(compound_name) filter at the chromatogram and there is no sorting for this section.

Here is the results:
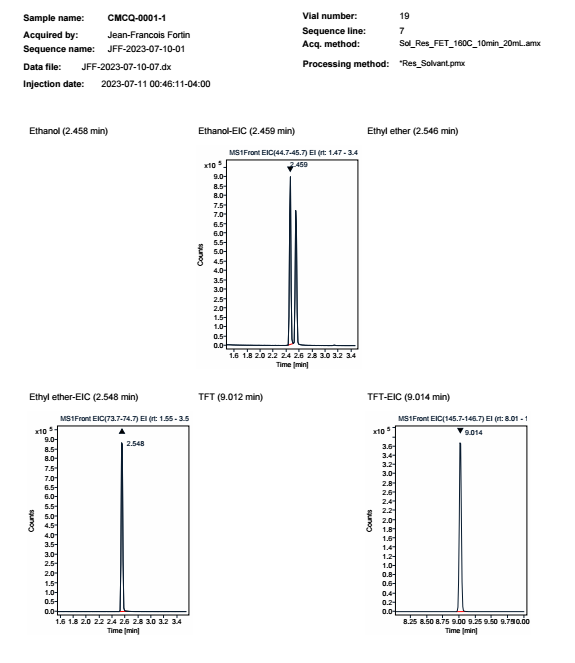
We can see that the filter EIC on the chromatogram doesn't work as final result as we can see blank chromato with no EIC as name compound.
I will try to add the EIC filter again on the outside filter.
it works! Even if I erase the EIC filter at the chromatogram portion. Thank you for your help. I will saved this composite group. If I add this composite group into a sequence summary report instead of single injection report, would you recommend to ass sorting based on injection ID?
I finnaly got what I have wanted. Thank you again. I tried to add the Multiplier used in the calibration Compound table used for a specific calculation with samples into my sequence injection summary:

But I only found multipliers that included the 5 possible multipliers.
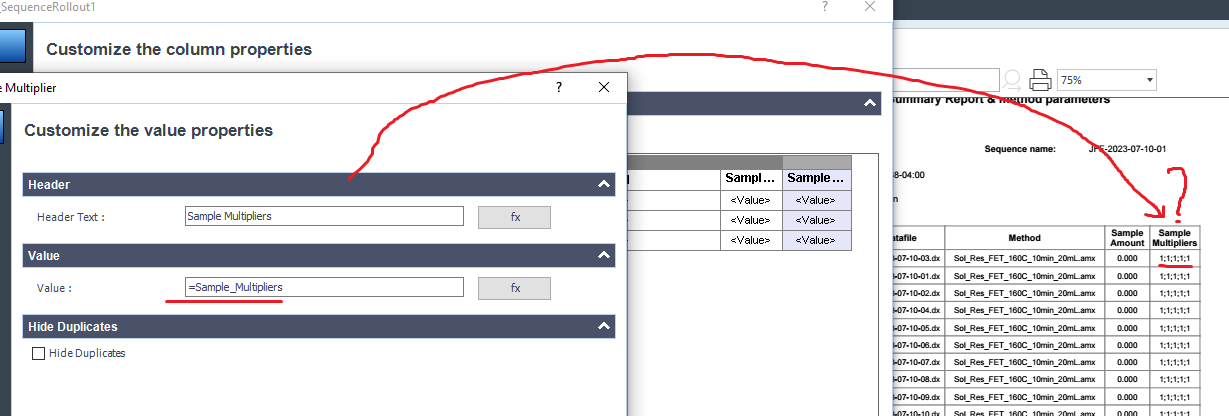
Do you know how to select a specific multiplier to add on the sequence summary?