Report Builder assistance

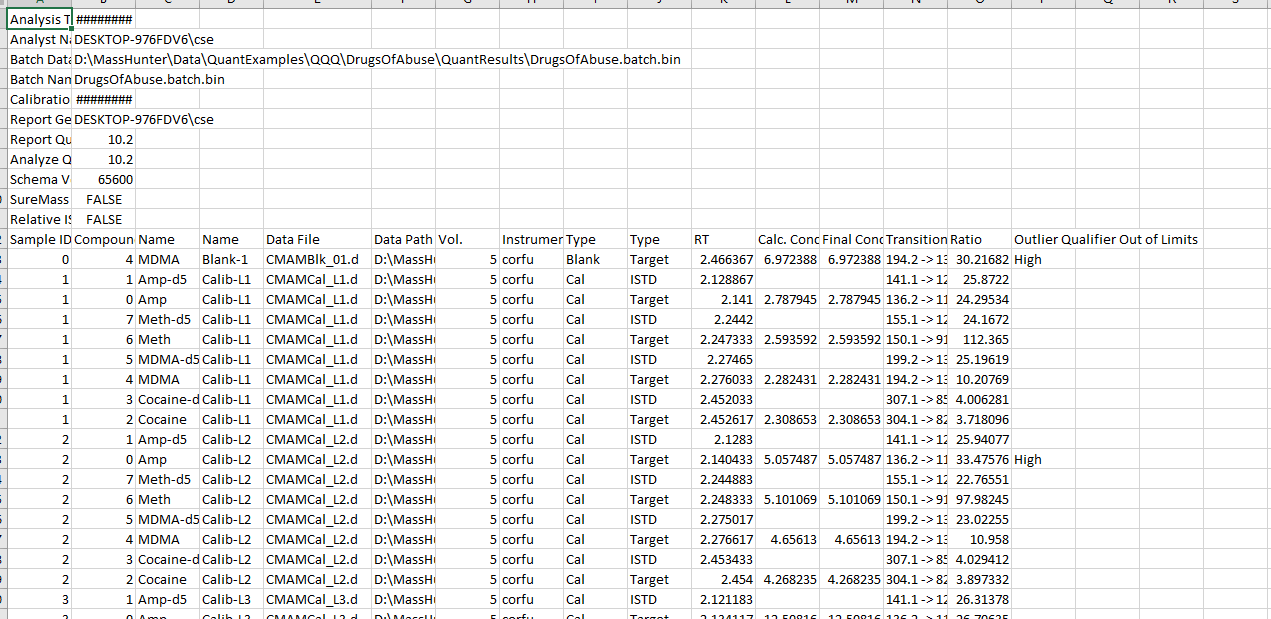
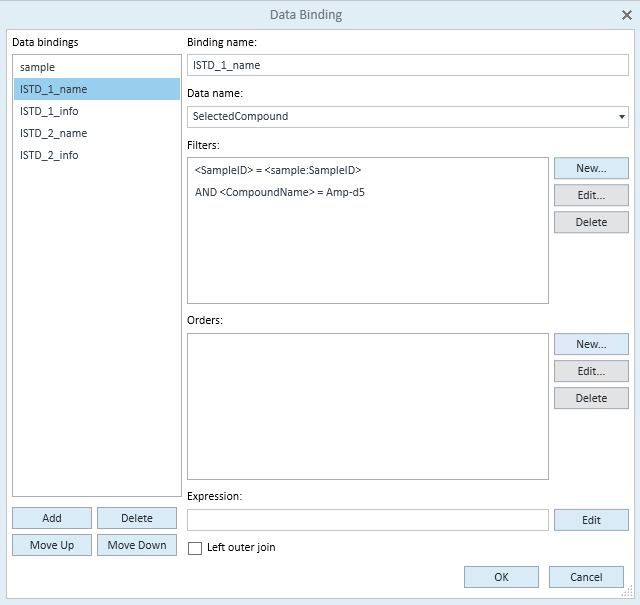
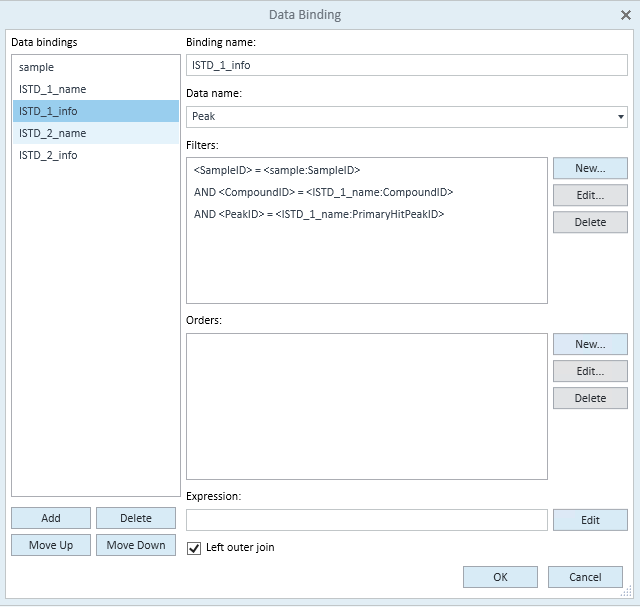
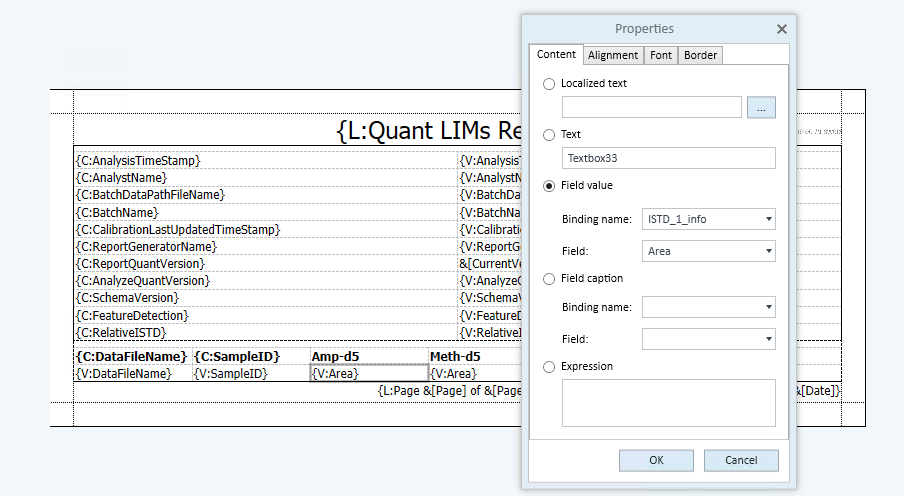
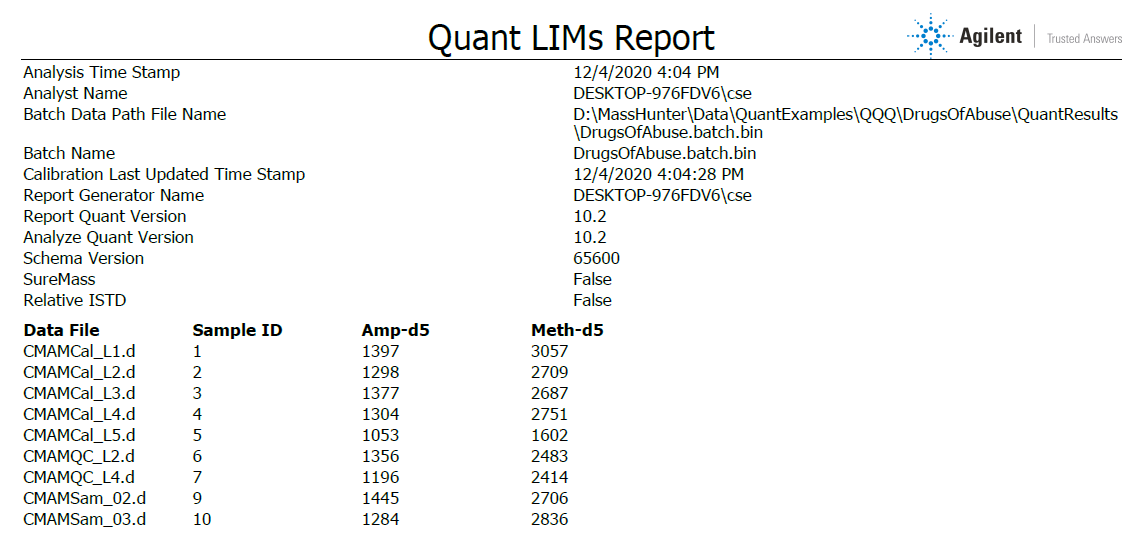
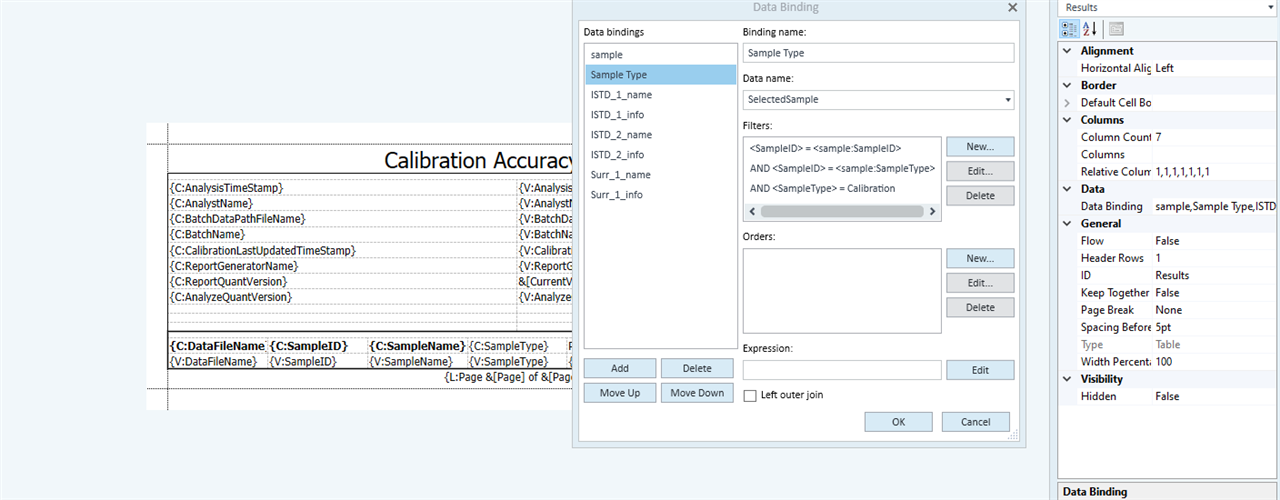
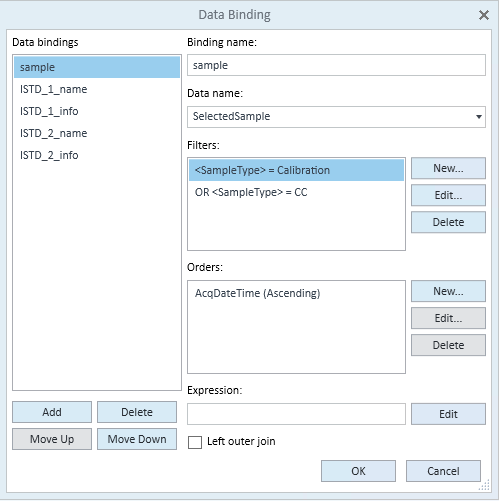
Hello! I am trying to create a report using Report Builder 10.2. What I'd like is a report that shows Data Files as a column on the left and the remaining columns show a ISTD response for each ISTD in a that sample. I've been starting with the templates (Gen_Complete_ISTD.template and Gen_Samples_ISTD.template) and tried to edit them, but the templates make separate tables for each ISTD bound to a compound. I would like a single table will all ISTD responses. I've reviewed the familiarization guide, and though I can follow it and make simple changes, I think the change in table type that I want is slightly different and outside the scope of the familiarization guide. It may have to do with how the data value are bound to the columns, but I can't quite figure it out. 

Does anyone know of additional sources of documentation for Report Builder so I can figure this out? Or, is anyone aware of template that is closer to the type I'm looking for (so that I could edit that template instead)? I've looked in the template files and I haven't found one yet that might be a good starting point.

Thank you!

  • Hello  ,

    The Gen_LIMs template would be a good one to start with. It lists all compounds for all data files in one large table. You can filter on Type for ISTD if you don't want targets to be reported. I have included CSV output below so you can have a better idea of what it prints. You can edit the table to include only what you want and to make it fit more nicely on a PDF report. 

  • Thank you very much for your reply. I checked out the Gen_LIMs template, and I agree that's a bit closer, but it doesn't have the data wrapping (??) that I'm trying to do.  I've include a table below showing the start of what I'm hoping to build. Data file is in the first column, and the columns 2-4 refer to the responses (peak areas) of the internal standards. Each row 2-6 gives the internal standard response of each internal standard for each file.

    I realize I could probably just make simple two-column reports with data file and one internal standard response, and then join them back together in excel, but I want to see if there was a way to generate the report already in this format, so then we could simply cut and paste the entire table. 

    Data File acenaphthylene D10 Response PCB-15-C13 Response phenanthrene D10 Response
    00201004.D 3692 3274 505
    00301005.D 3434 3066 444
    00401006.D 3275 2878 420
    00501007.D 3085 2618 377
    00601008.D 3070 2550 384
  • Hello  ,

    Reports like that are not easy to make in Report Builder because of how the data tables are stored and how the reporting works. It is possible with some careful bindings and a bit of repetition and hard coding. There are some examples in the Community where customers have done similar reports and have multiple qualifiers on the same row. You would need to make two bindings for each ISTD you want to report. It may be possible to simplify this with some clever work, but for an example I just hard coded the compound names and in limited testing this works.  

    You can modify the existing bindings in the LIMS template and filter for the ISTD name in the SelectedCompound binding and then reference that binding in the Peak binding for each ISTD.

    Then change the column headers to be Text and just put the name of the ISTD in that column. Then in the value cell reference the appropriate ISTD binding, ISTD_1_Info, ISTD_2_Info, etc.

  • Thanks again for the help, howard_sanford. I've taken what you suggested and I'm able to make a report template that works, and also changed the results output for different parameters. I have two follow-up related questions for my next steps in this process if you're willing to continue your assistance:

    1) I'd like to add a filter for sample type for this report, so that the report template only shows samples marked as Calibration or CC. I tried to do this my setting up another filter but the error I receive upon preview is "Cannot find column [Sample]". I've attached a screenshot of the data binding that doesn't work. Can you see how to correct this filter?

    2) Ultimately, I'd like to be able to make these templates for several different analyte and ISTD lists, and some have 40-50 analytes and ten or more internal standard. As you mentioned, this process for setting up templates is lots of repetitive coding. Though I'd like to have these types of reports generated because this format significantly reduces our post-report data analysis time, I'm seeing that it's going to take some time to get these setup and will have to be altered every time we add or remove analytes or ISTDs.  With that in mind, is Report Builder going to be the best way to go long-term? Or should I be investigating another approach for this type of output? (is going to be faster to edit Excel templates, for example?)

  • Hello  ,

    You shouldn't need to make another sample binding, unless you want to only report some compounds for certain samples and others for a different sample type. You can just change the first binding named 'sample' to filter for Cal and CCs.

    Due to how the data tables are stored in quant batches, I am not aware of any easy way to create a more flexible template of this type. It might be possible in Report Builder if you utilized Python code in hidden cells to get the data from quant, store it in another data structure, and then access this data structure in another list or table. There is a simple example in this discussion.

    (20) Add statistics (mean, stdev) for a column in MassHunter Report Builder - Forum - Mass Spectrometry Software - Agilent Community

    Though I believe you would need to go a bit beyond what is done in that example.

    I don't believe this will be any simpler in Excel, and would be much slower, potentially taking 20-50x longer than a Report Builder template to process.

    The most flexible solutions are the Python based reports. These are the templates that are in the PDF-Reporting folder and that are documented in the SDK. This requires a firm understanding of Python and relational databases. I believe you would still need to organize and report from your own data structure after you get the data from quant, but it should allow for the flexibility you require.

Was this helpful?