Find maintenance, best practice, and troubleshooting articles.
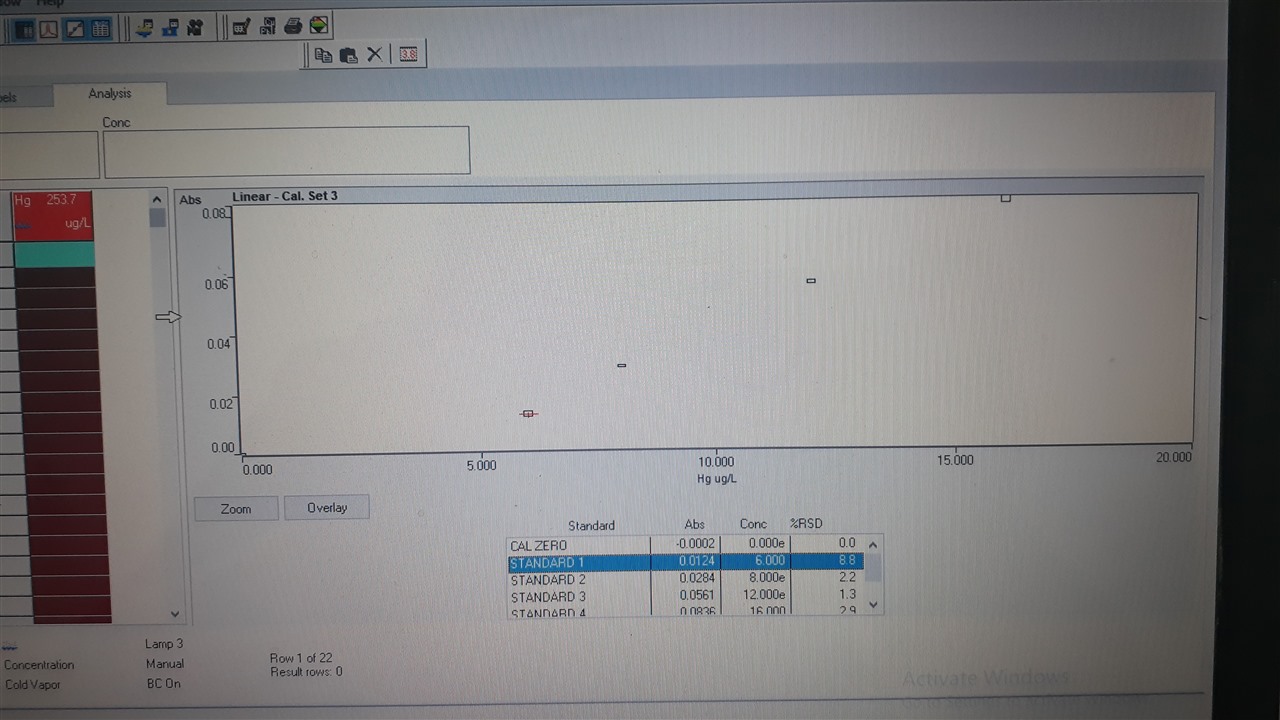
We have a problem in the mercury calibration curve. When passing the patterns, the program does not plot the curve. The equipment we use is Aggilent 240Fs AA.
Hello Micela, May I request to reverify the concentration values, This seems to be a serial dilution standard preparation, and the concentration looks like 32, 16, 8, 4 ppb.
The absorbance represented an excellent correlation. Additionally, there are a few replicates omitted from STD 2 and STD 3, Are there any spikes over there? Hopefully, trace-level acid must be used for STD preparations.
It looks to me that the curve is not being plotted as the software is unable to fit the data points to the calibration algorithm you have specified. Although the points above 5 ug/l are roughly linear the point at zero does not fit. Try selecting the zero point and masking it. You may find a calibration is then plotted
It looks to me that the curve is not being plotted as the software is unable to fit the data points to the calibration algorithm you have specified. Although the points above 5 ug/l are roughly linear the point at zero does not fit. Try selecting the zero point and masking it. You may find a calibration is then plotted
We are glad this was helpful! We are sorry this was not helpful. If you still need assistance please create a community post or contact support. To help us improve, please provide any additional feedback.
For full details of how we will treat your information, please view our privacy policy.