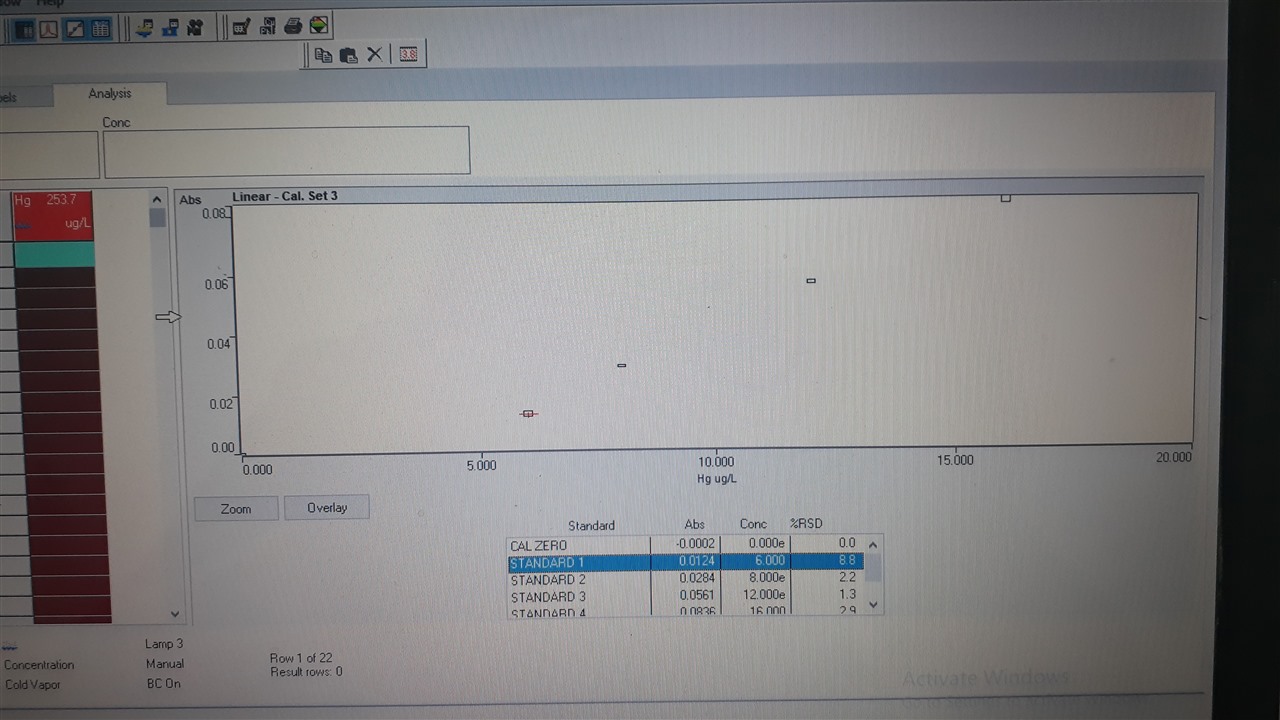

Hello Micela, May I request to reverify the concentration values, This seems to be a serial dilution standard preparation, and the concentration looks like 32, 16, 8, 4 ppb.
The absorbance represented an excellent correlation. Additionally, there are a few replicates omitted from STD 2 and STD 3, Are there any spikes over there? Hopefully, trace-level acid must be used for STD preparations.
Hi Micela,
It looks to me that the curve is not being plotted as the software is unable to fit the data points to the calibration algorithm you have specified. Although the points above 5 ug/l are roughly linear the point at zero does not fit. Try selecting the zero point and masking it. You may find a calibration is then plotted
Kevin
Hi Micela,
Try to double-check the standard creation. I see at the point of std 1 it is not good. And make sure in the measurement delay 45>60-70s, to ensure the sample / std reacts perfectly.
If using an autosampler change the measurement 45>90s. Because I see a large rsd where usually the reaction has not stabilized. I recommend Sncl2.