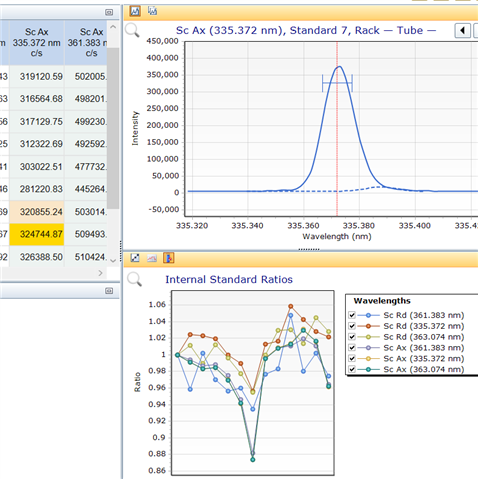
I'm trialling some online internal standards on a newly developed method for analysis of biological fluid samples containing Zn, Fe, Mg, Ca, K, P, Na. The internal standards I'm using in a mix are Sc, Y, Eu (10 ppm) and Rh, Ir, Bi (50 ppm). The diluent used is the same for both IS and calibration standards - 1% HNO3 and 0.01% Triton X-100
I've noticed when generating the calibration curve the IS stability ratio plot trends downwards for each standard (as seen below) which means an enhancement of the internal standard counts which seems to happen for every IS used. Could it be possible that the presence of K (1-10 ppm) and Na (20 - 120 ppm) is enhancing the IS signal as when I run the IS with just Zn, Fe, Mg there is no downward trend seen for the IS stability plot.
Would a cesium ionisation buffer be a help in this case?

