5100 ICP-OES Internal Standard Enhancement During Calibration

I'm trialling some online internal standards on a newly developed method for analysis of biological fluid samples containing  Zn, Fe, Mg, Ca, K, P, Na. The internal standards I'm using in a mix are Sc, Y, Eu (10 ppm) and Rh, Ir, Bi (50 ppm). The diluent used is the same for both IS and calibration standards - 1% HNO3 and 0.01% Triton X-100

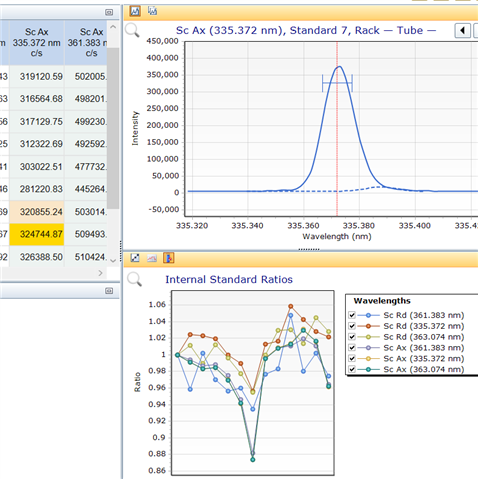
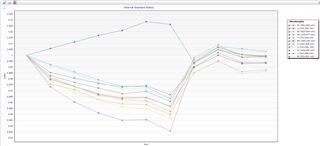
I've noticed when generating the calibration curve the IS stability ratio plot trends downwards for each standard (as seen below) which means an enhancement of the internal standard counts which seems to happen for every IS used. Could it be possible that the presence of K (1-10 ppm) and Na (20 - 120 ppm) is enhancing the IS signal as when I run the IS with just Zn, Fe, Mg there is no downward trend seen for the IS stability plot.

Would a cesium ionisation buffer be a help in this case?

Parents
  • I'm afraid that IS ratio drop means a drop in IS signal, not an enhancement.

    High concentration of other elements is inducing a matrix effect.

    To overcome this, robust conditions should be used, and reading in Radial mode is worth to check

  • Thanks for your opinion.

    The IS stability plot is a little misleading because the IS intensities are actually increasing progressively as you go from Standard 1 (Blank) to Standard 7 but because the IS is ratioed with the IS Blank /IS Cal Stds it appears as a decrease on the ratioed stability plot but in reality it is actually a IS enhancement effect. The measurement conditions used are the default in terms of RF power so I don't suspect its the robustness of the plasma in question. Possibly the use of Cs and the reading of the IS's in Radial mode will offer a remedy. 

    This is how the IS is being treated by the instrument software: 

    Analyte SignalCORR = Analyte SignalMEAS x ISINIT/ISMEAS

    Where Analyte SignalCORR = Corrected Analyte Emission Intensity

    Analyte SignalMEAS= Measured Analyte Emission Intensity

    ISINIT = Initial Internal Standard Emission Intensity

    ISMEAS = Measured Internal Standard Emission Intensity

Reply
  • Thanks for your opinion.

    The IS stability plot is a little misleading because the IS intensities are actually increasing progressively as you go from Standard 1 (Blank) to Standard 7 but because the IS is ratioed with the IS Blank /IS Cal Stds it appears as a decrease on the ratioed stability plot but in reality it is actually a IS enhancement effect. The measurement conditions used are the default in terms of RF power so I don't suspect its the robustness of the plasma in question. Possibly the use of Cs and the reading of the IS's in Radial mode will offer a remedy. 

    This is how the IS is being treated by the instrument software: 

    Analyte SignalCORR = Analyte SignalMEAS x ISINIT/ISMEAS

    Where Analyte SignalCORR = Corrected Analyte Emission Intensity

    Analyte SignalMEAS= Measured Analyte Emission Intensity

    ISINIT = Initial Internal Standard Emission Intensity

    ISMEAS = Measured Internal Standard Emission Intensity

Children
Was this helpful?