MP-AES auto - background correction feature

Hi everyone in the community, 
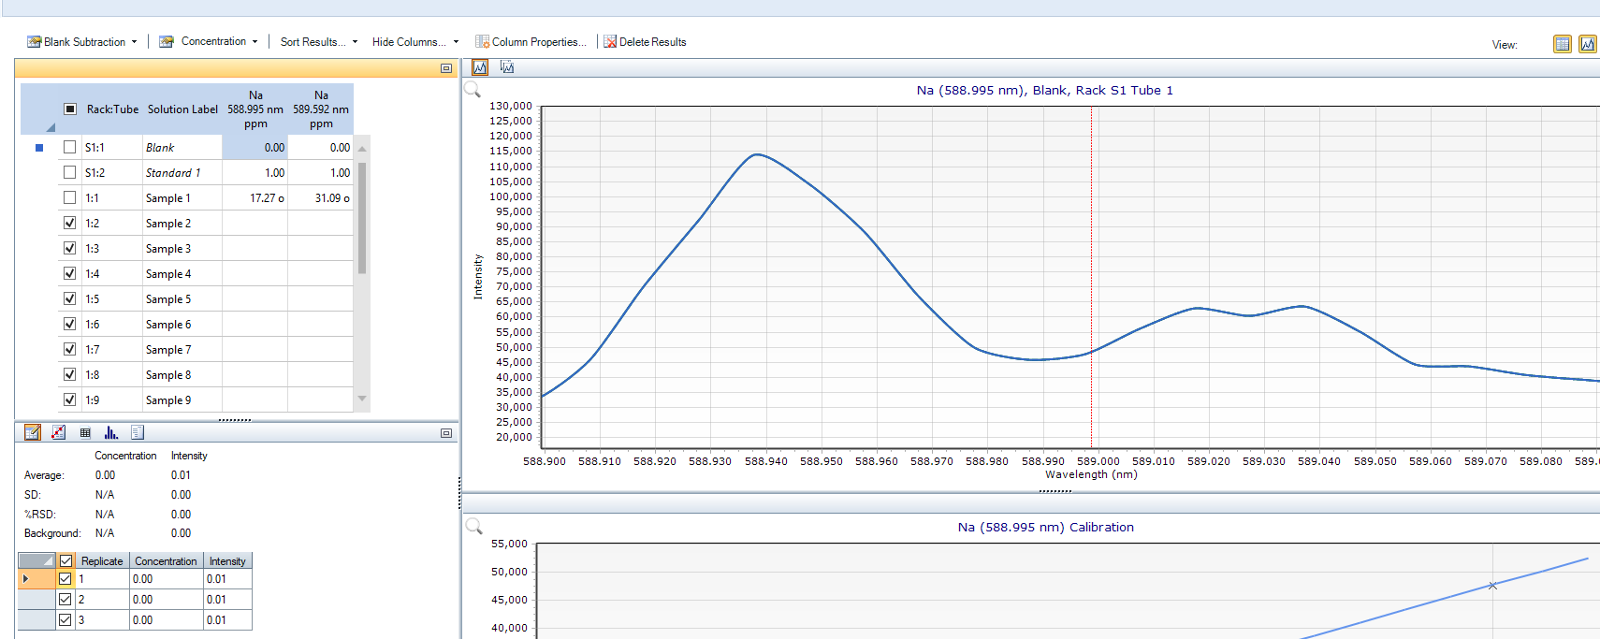
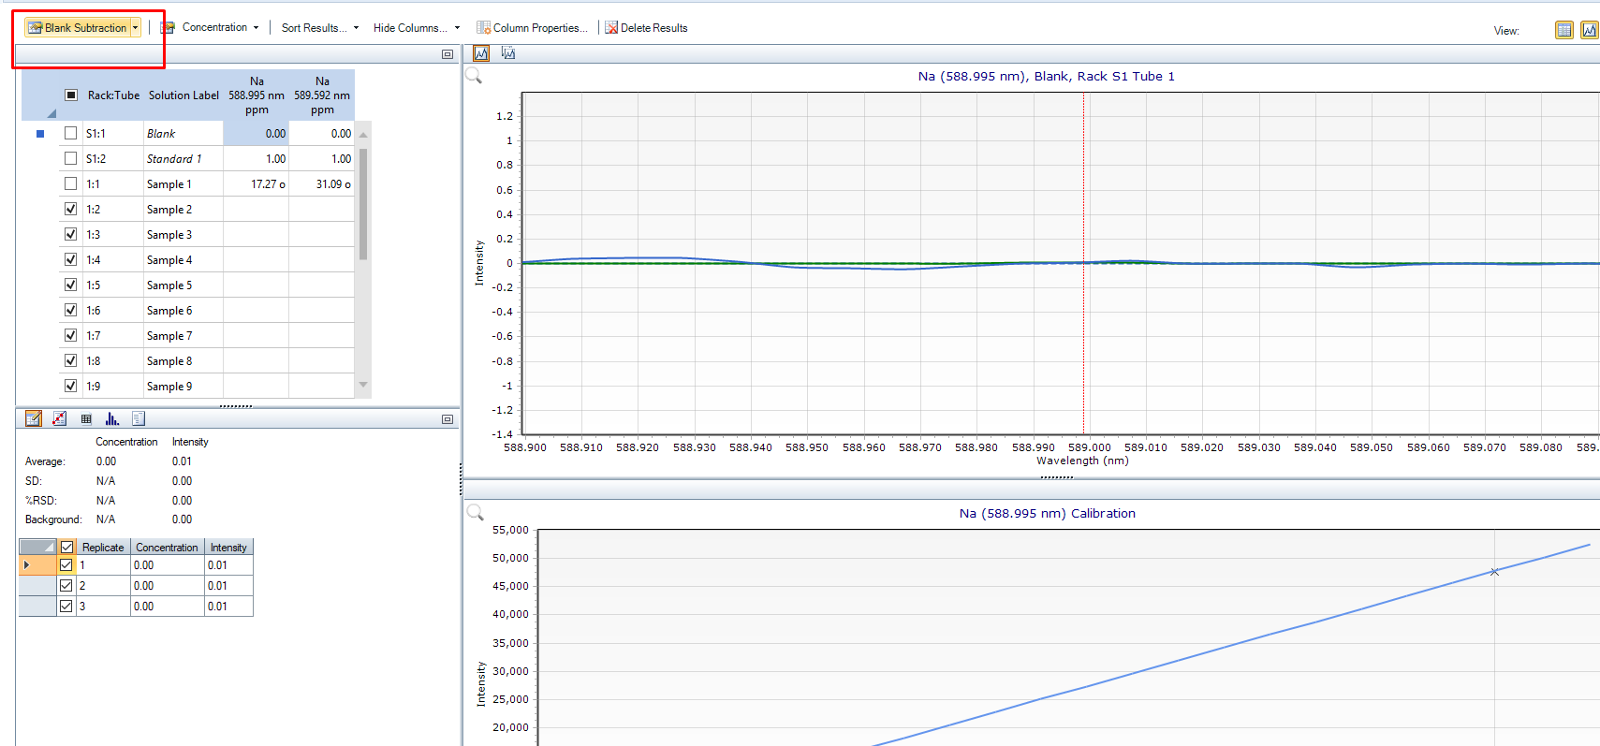
While I was performing an analysis with the MP-AES I noticed that the linearity of my calibration curve for zinc was quite high (R=0.997) when I used the auto background correction feature in the MP Expert software compared to the non-linearity (R=0.53) I observed when background correction was turned off so that I could look at the raw data.


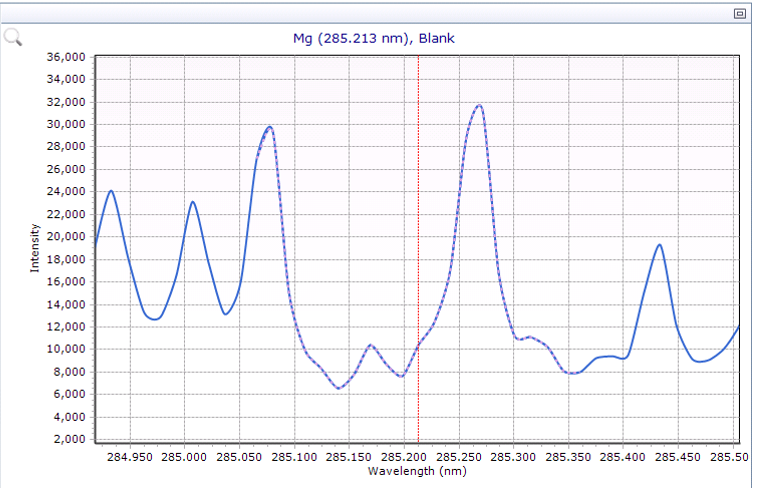
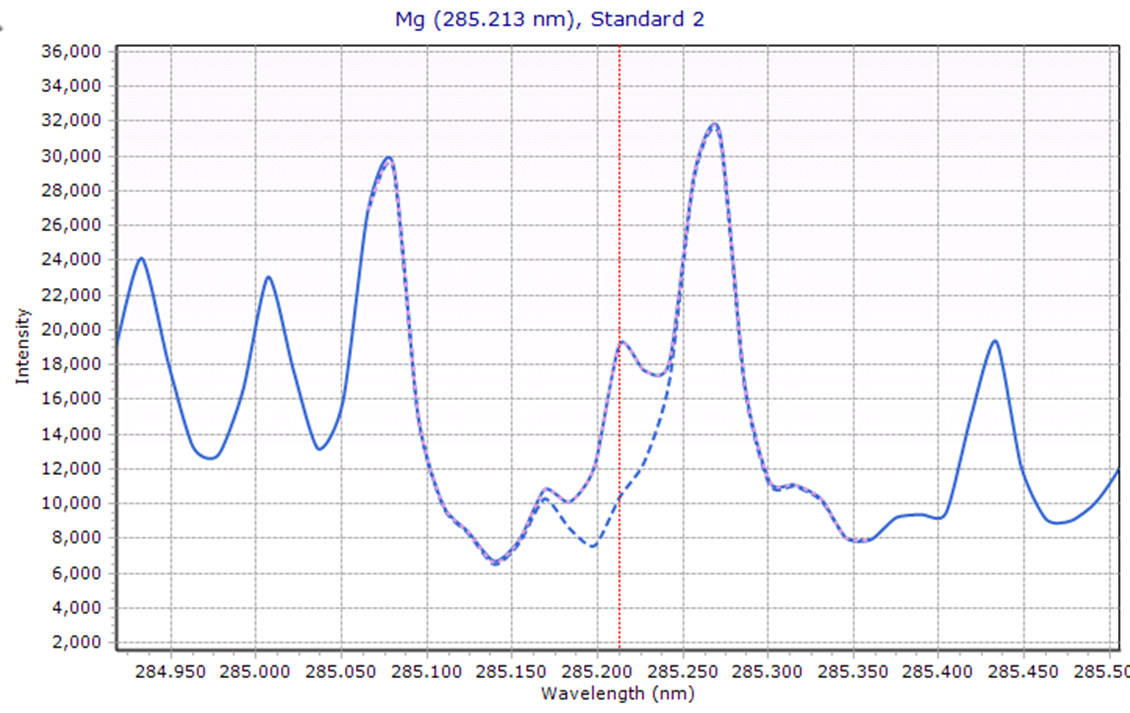
My question is how does the auto background correction work to reduce interference and noise to isolate the signal so adequately? 

The description in the software states that it calculates the concentration using the total intensity but is there any more to this fact? I've searched online but also couldn't find an answer.


I would greatly appreciate some feedback! 


Thanks all,


Shane Grant

  • Hi Shane,


    How is the non-linearity line performed, without the background correction with off-peak?


    The background correction of the MP Expert software is dynamic and based on the Blank and Standards graphic. It's very important that the Blank is the same matrix as the samples and that the lowest standard has a quite good defined peak shape.

    With the black graphic compare to the difference in shape of the standards the software made a background profil. This profile could be seen if the "Black Subtraction" is set off.


    The linearity for the MP-AES should be very high and quite long if you have wel defined peak shapes and if you don't have spectral or physical interference. 


    is this answer you question?

  • The Auto background correction uses the blank as a model for the background and the standards as a model for analyte peak for the rest of the run. For every sample the amount of blank model and amount of analyte model in the spectrum is calculated.  Once the amount of analyte is known the intensity can be determined.  It is important not to use very low level standards in calibration as it will affect how clear the analyte models peak shows up.

    Auto background correction does a few things:  1) it corrects for any shift, up to 1 full pixel, of drift on the detector, 2) the calibration blank is used for the blank model to remove spectral peaks, 3) it uses the calibration standards as the model for the analyte peak.  The spectral peaks could be from OH, Nitrogen, Oxygen, etc that are present in the plasma and show up in the spectrum window.

    Below is the spectrum of a blank:

    You can see there are peaks around the center line.  Next is the spectrum of a Standard:

    The dotted line is showing the blank model that will be subtracted to give analyte intensity.

    Lastly we have the sample.  Again the dotted line is the blank model.  The red line is in the middle of the analyte peak (same as on the standard) so we know it is our Mg intensity:

    Hopefully this helps explain how Auto background works.

Was this helpful?