Hi all,
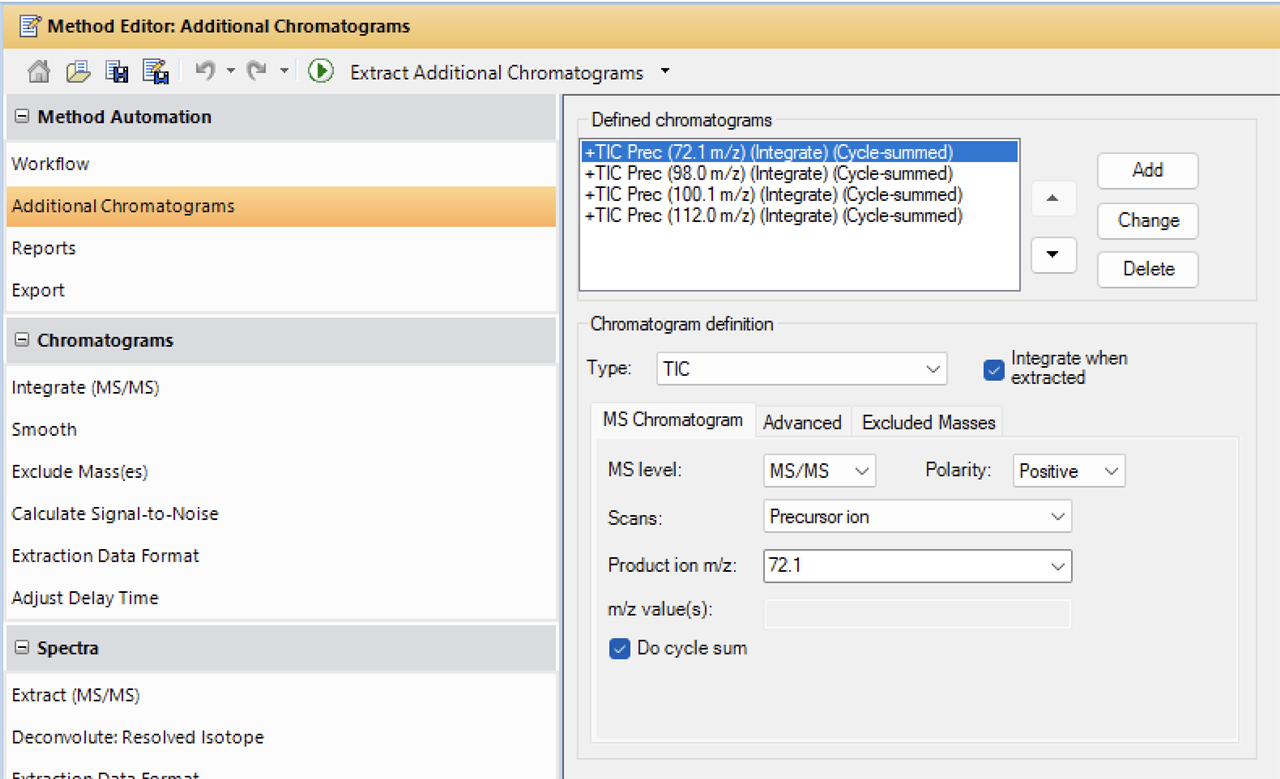
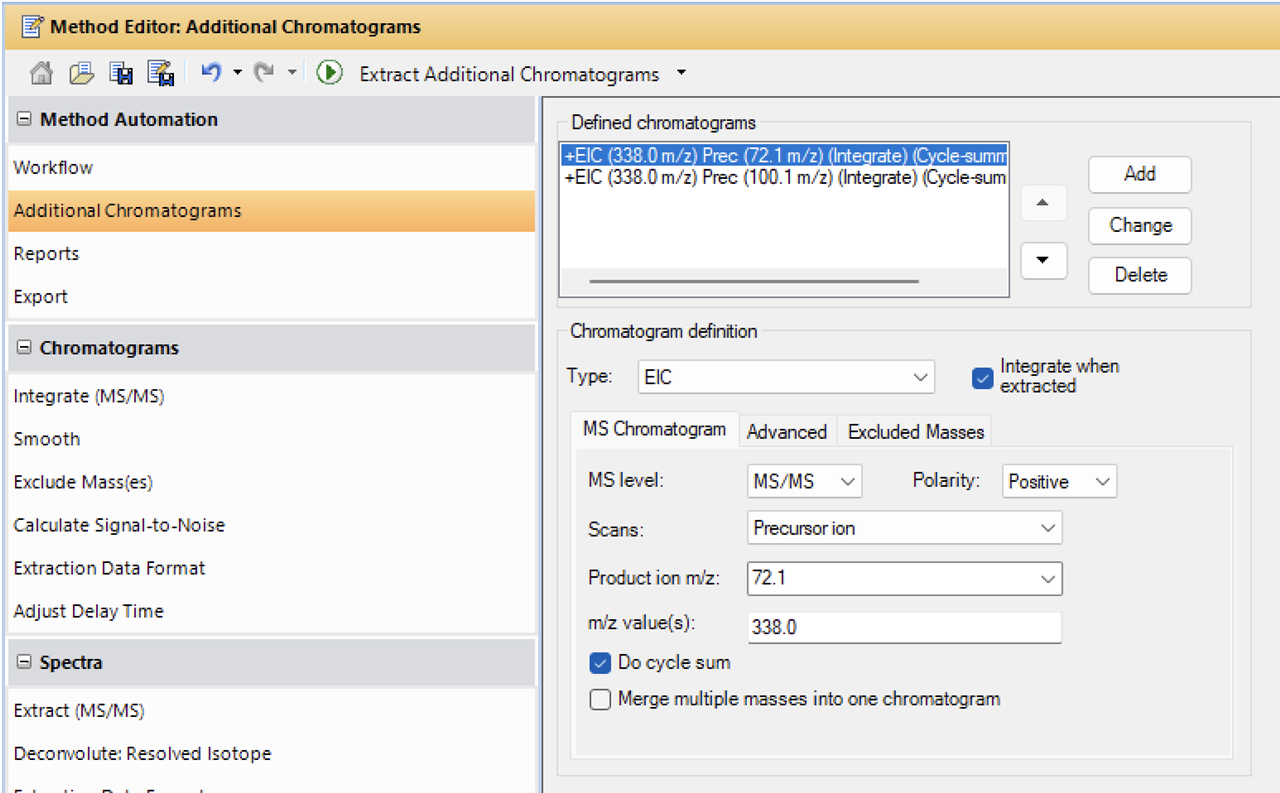
I've recently encountered an issue in MassHunter Qual v.10 when creating a custom workflow. I have added "extract additional chromatograms" to the workflow and noticed that the peak area it outputs is different based on whether I am extracting a TIC or an EIC. For reference, I am running on our 6475 QQQ, and acquiring my data in precursor ion scan mode. I monitor 2 primary product ions that are characteristic of the compounds I am studying (nitazenes), which are m/z 100 and m/z 72. An example of the values I received for one of my compounds, metodesnitazene, extracted from the same data file:
m/z 100 peak area extracted with TIC: 3,658,123
m/z 100 peak area extracted with EIC: 2,418,212
Obviously those are completely different values but there's nothing I can find that would make sense as to why they are so different. Additionally, when looking at the spectra, the abundance of the precursor ion for m/z 100 is the same for both processing methods, but the abundance of m/z 72 is different. I have attached screenshots of the "additional chromatograms" section of the method editor for reference as well (note that the EIC method only includes the extraction for one of my compounds as I was just testing the changes). Any help about this is greatly appreciated since I am hesitant to process/collect more data until I know where these numbers are being pulled from.