Masshunter Quantitative analysis version B.09.00 not generating peak area under EIC.

Hi all,

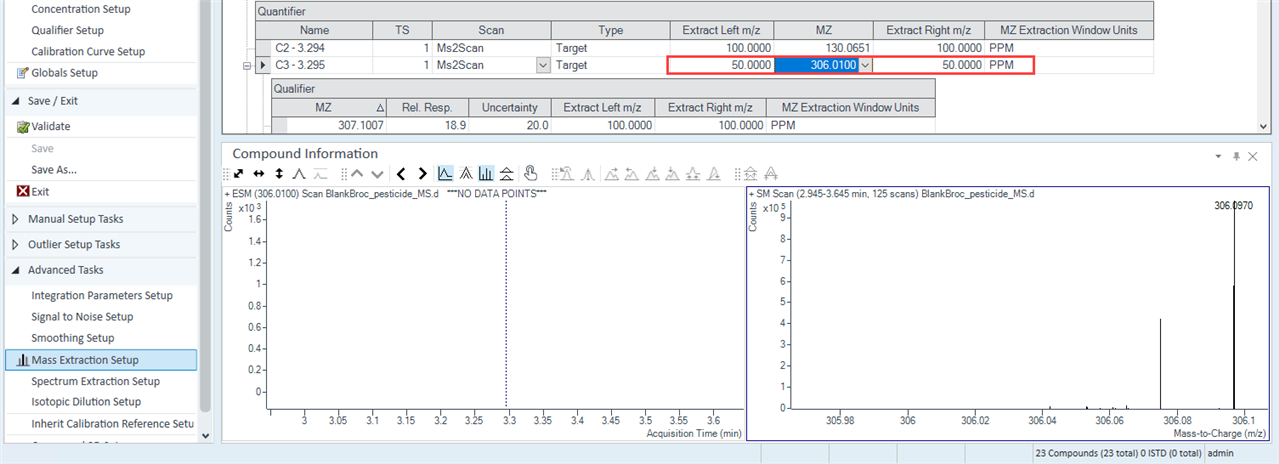
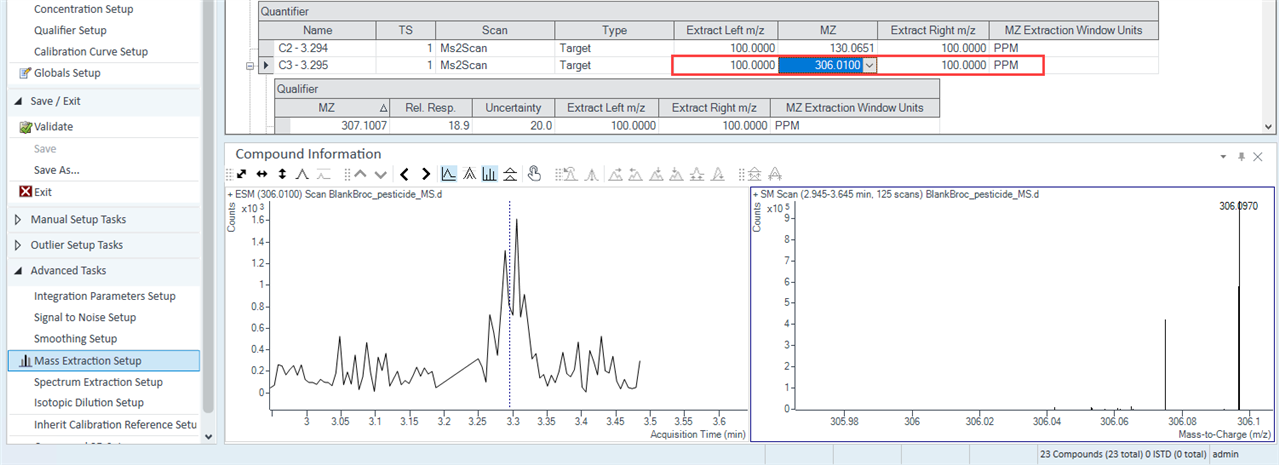
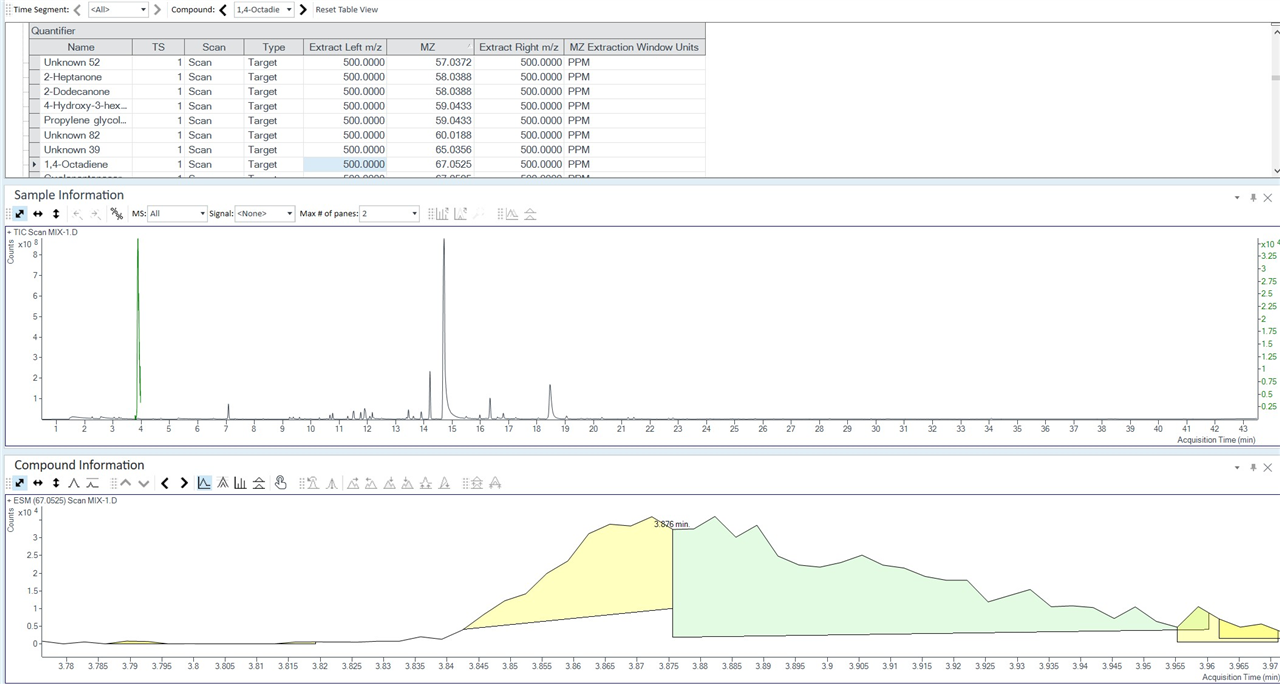
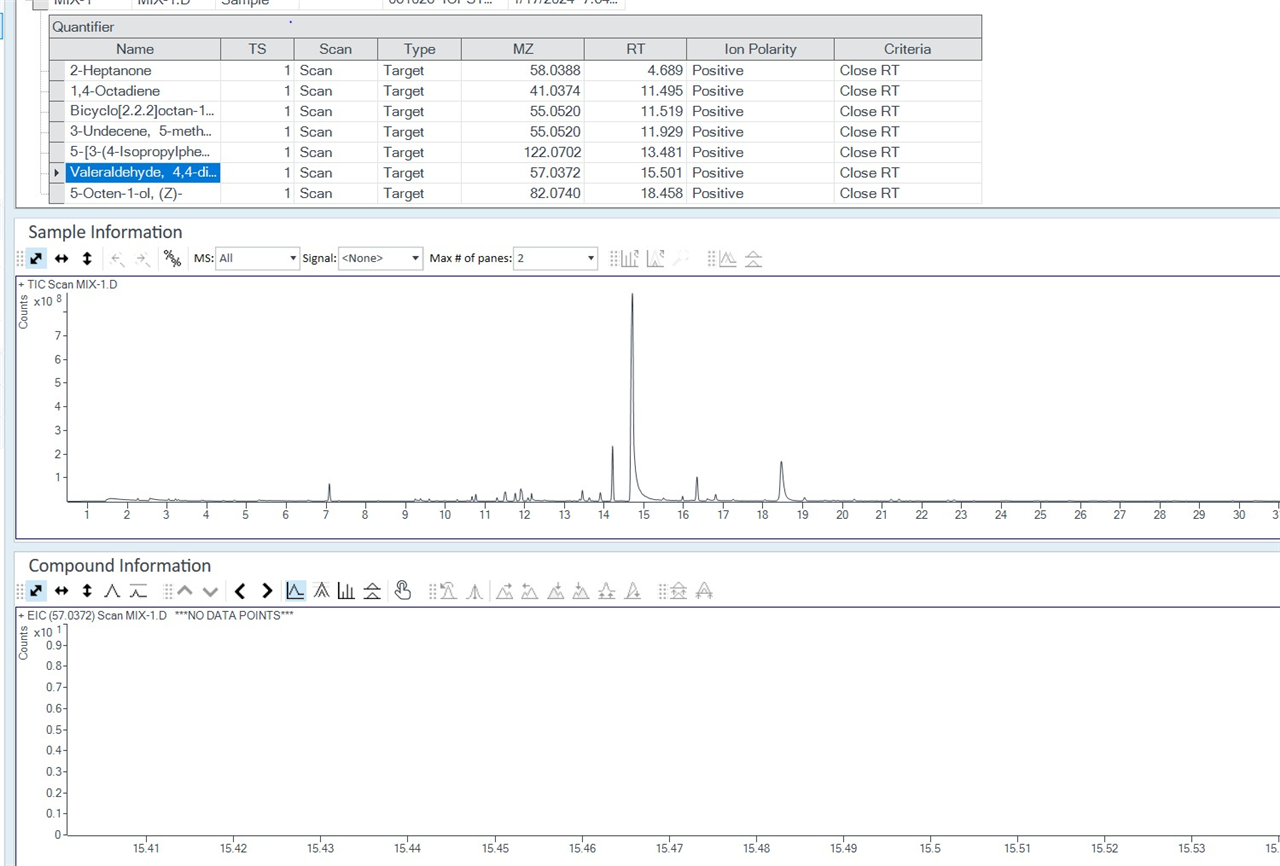
I am using Masshunter quantitative version B 09.00 (for TOF) to analyze some scan GC MS data from my GC QTOF. I would like to find out the peak areas for my ions of interest under extracted ion chromatograms, but the EIC results from masshunter quant show 'no data points' (as shown in the image below).

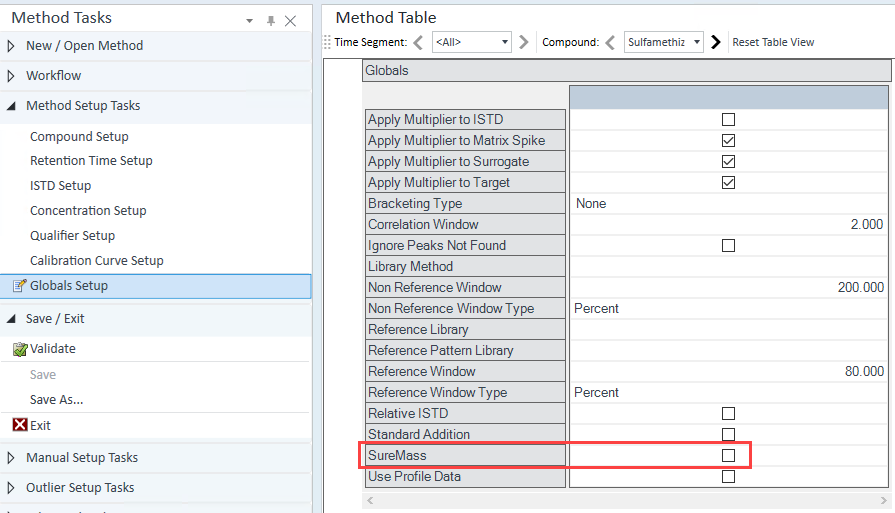
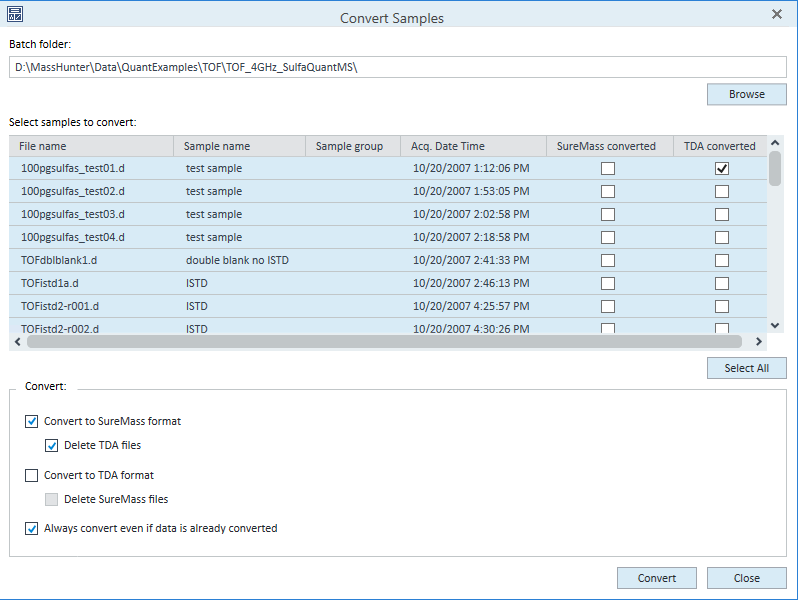
I converted my GC QTOF data into suremass and TDA format, but it shouldn't influence the analysis in Masshunter Quant. 

Any suggestion to make it work? Thanks!

  • Hello  ,

    There are a few things you can check. First check your MZ and your mass extraction window to make certain there is signal present. This is an extreme example, but you can see that there will be no data points extracted if the MZ or the extraction range is not set appropriately.

    I would also check your signal without TDA conversion and with SureMass disabled, as in certain cases there can be issues with feature extraction and indexing that can cause signal issues. If TDA information is present quant will use this by default. SureMass will only be used if it is enabled in the Method Global Setup section. To check your data without either feature, first make certain that SureMass is disabled in your method.

    Then you can go to the Tools->Convert Accurate Mass samples menu and choose to Convert to SureMass format and Delete TDA files. You may also need to choose Always convert even if data is already converted.

    You can also manually delete the TDA files from the data folder, but I would suggest making a backup of your data files before trying this to be safe. The files to delete are located in the AcqData folder within the .d folder.

    TDA.bin
    TDASpec.bin
    TOFDataIndex.bin

    When reloading the batch make certain to select No when prompted to perform TDA conversion. 

  • Hi Howard,

    Thanks for the help! I was able to get Quant to integrate peak area under EIC by enabling 'SureMass' in the global setup. Once I got the peak areas, I noticed there is another problem. In the integration results, there are bad integrations (shown in picture below). I tried to correct it by clicking 'manual integration', but Quant would crash with any editing I did. Do you know why it's like this and if there is a method to fix it? Thanks!

  • Hello  ,

    First, you could try running the Quant Restore User Settings tool. Before doing this make certain you have any custom column or screen layouts saved in Quant, UA, and the Library Editor (if they can be launched). Also make note of what report methods you are using, as this information will also be cleared when you use the tool. Then close all open copies of Quant, UA, and the Library Editor and run the tool. 

    The Restore User Settings tool can be found in the Windows Start menu under Agilent MassHunter Quantitative->Quantitative Analysis Tools->Restore User Settings.

    If that doesn't work, then I would investigate your integrator and data extraction settings. The manual integrator will be limited by the selected integrator and its settings. This type of error is possible if the resulting peak is too far outside the bounds of what could normally be integrated. Based on your screenshots, the first thing I would suggest is to try opening up the RT extraction window, if that is allowed by your method and lab procedures. You have a very limited amount of baseline outside of the peak, and this may cause issues for the integrator. 

    If that doesn't work, or you cannot adjust that, then there are some more suggestions in this discussion. Their error was different, but I suspect the reason for the error is similar. 

    (+) Manual Integration Error - Index was outside the bounds of the array - Forum - Mass Spectrometry Software - Agilent Community

Was this helpful?