Unknowns Analysis reporting--first TIC in batch is missing the baseline (but ONLY the first one)

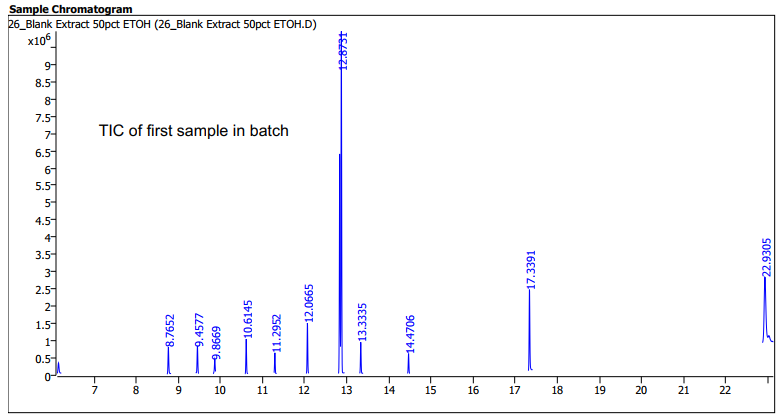
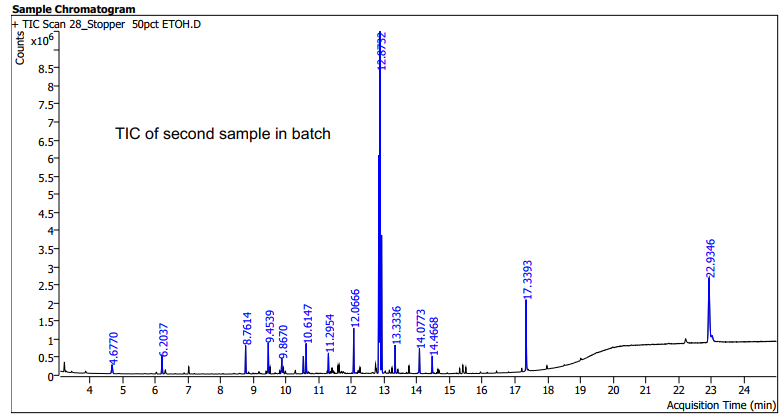
I recently edited a report template for Unknowns Analysis that includes a TIC for each sample. When I generate the report, the x axis of the TIC of the first sample in the batch is scaled from the first peak to the last (not the entire acquisition time), and the baseline is completely missing. All subsequent TICs show the full x-axis and show the baseline, as I expect. I've tried changing the Graphics Settings but had no luck. Why is this happening / how can I fix it?

Parents Reply Children
  • Hi, Howard.  Using the original template (LRS_NonTarget_Details.template.xml), the baseline is shown as expected.  Any change I make to the original template (moving the TIC above the compound list, changing the TIC height from 700 to 300, or even just changing a text item from right justified to centered), however, causes the baseline to disappear.

    Chad

  •  ,

    I'm not observing this in either version 10.2 or 12.0. What version of UA are you using? And what version of Report Builder are you using to edit the templates?

    In your example the first chromatogram has a different signal label. Was it processed with a different method?

    If a new reporting method doesn't resolve the issue, you could try running the Quant Restore User Settings tool. Before doing this make certain you have any custom column or screen layouts saved in Quant, Unknowns Analysis, and the Library Editor (if they can be launched). Also make note of what report methods you are using, as this information will also be cleared when you use the tool. Then close all open copies of Quant, UA, and the Library Editor and run the tool. 

    The Restore User Settings tool can be found in the Windows Start menu under Agilent MassHunter Quantitative->Quantitative Analysis Tools->Restore User Settings.

  • I'm using UA version 10.1 and Report Builder version 10.2.

    Both chromatograms were processed with the same method.

    I tried the Restore User Settings tool with mixed results:  the baseline shows up sometimes, but not always.  Additional suggestions?

  •   ,

    Is the data, report method, or report template on a network share? This has been known to cause issues and is not a supported configuration. All data, methods, and templates should be located on the local hard drive for standalone data systems. 

    Another thing to check would be to make certain you started from the correct version of the template. In the 10.x versions of Quant there were extra copies of the Report Builder templates in 

    \MassHunter\Report Templates\Quant\PDF-Reporting\Unknowns

    These have known issues and should not be used. The correct Report Builder templates for UA are located in 

    \MassHunter\Report Templates\Quant\PDF-ReportBuilder\Unknowns

  • I did use the templates from the PDF-ReportBuilder\Unknowns directory, so I think I used the correct ones.

    With regard to the network share question, is an ECM server considered a network share?  Our data, methods, and templates are stored on ECM for data integrity reasons.

  •  ,

    If your system is configured for ECM then it is not a standalone workstation and is designed to work only with the ECM server.

    A network share would be a file location on another Windows PC or server that is mapped to appear as a local drive on a PC. These types of locations are not supported to be used by a standalone workstation for storing or processing data or methods.

    At this point I'd recommend contacting your local support team for further assistance since this is currently not a known or reproducible issue. 

Was this helpful?