How do I view UV spectrum data in the MassHunter Quantitative software

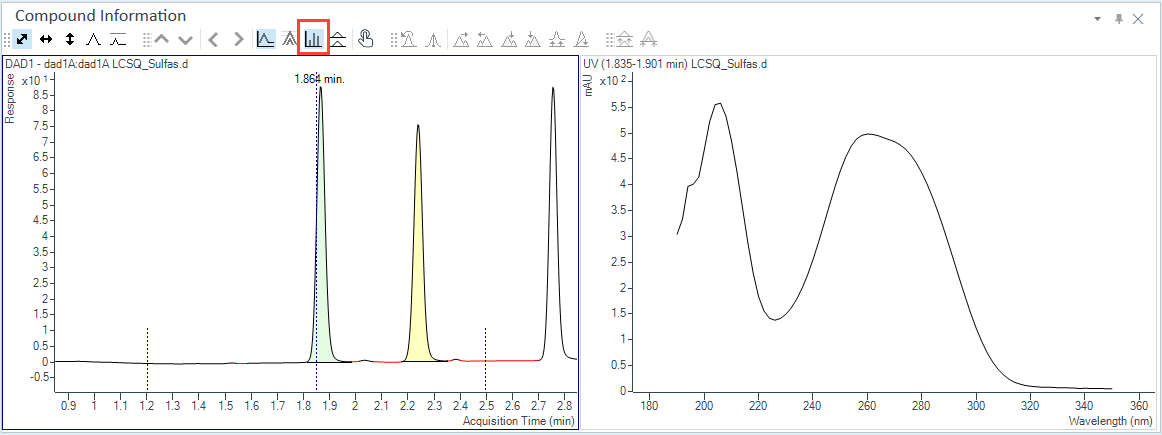
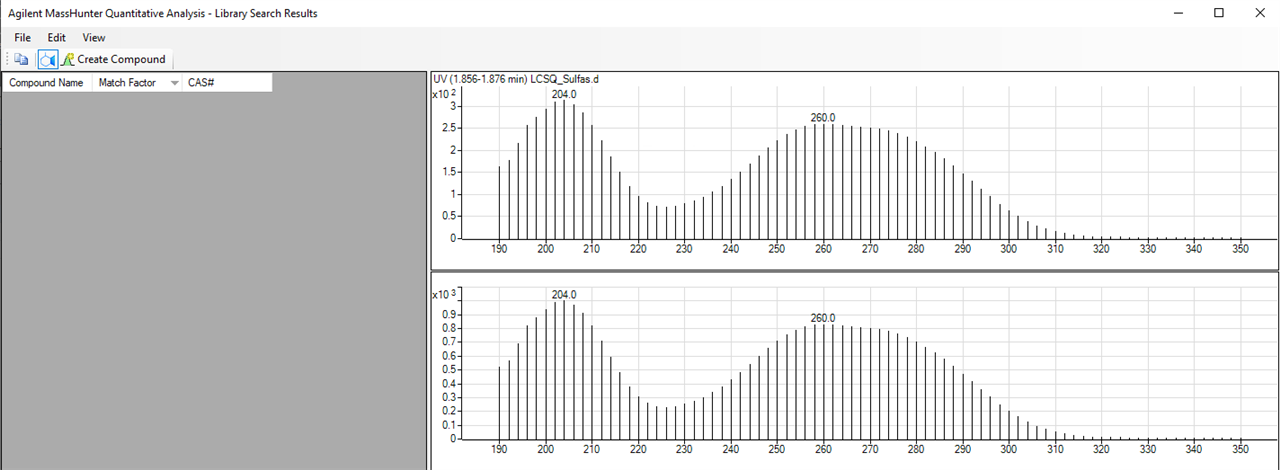
We are currently using LC-UV for quantitative analysis (until the QQQ can be validated) and I cannot see the UV spectrum in the Quant software.  Since we added a triple quad, we no longer have Open Lab to analyze the UV data.  Is there a way to see the UV spectra in the Quantitative software?  I can only extract the MS data but I need the UV data.  I know I can see UV data in the Qualitative software but that won't label my peaks or the UV maximas.   I think I can get UV data to print on the report if I add PeakSpectrum but the scaling is weird.  Any help would be appreciated.  Thanks!

Parents Reply
  •   ,

    There are limited options available for working with UV spectrum. In qual you can, of course, export to CSV and determine the maxima. There is not a way to label the UV spectrum peaks automatically in qual, though you can enable the annotation tool and if you select the highest point and choose to add an annotation it will list the X coordinates in nm. 

    The only option I can find in quant to see the maxima is almost certainly not intended, but it does appear to work. If you right click on the UV spectrum and choose Search Library... and then Cancel the library selection you will be presented with a 'centroided' version of the UV spectrum. 

    It appears to label each local maxima. You can also zoom in and each 'peak' will be labeled. 

Children
Was this helpful?