How do I view UV spectrum data in the MassHunter Quantitative software

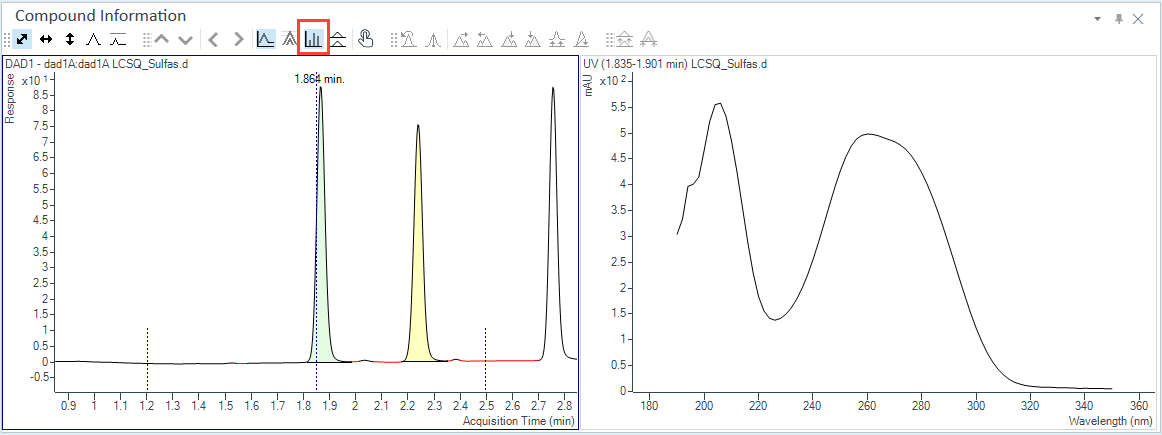
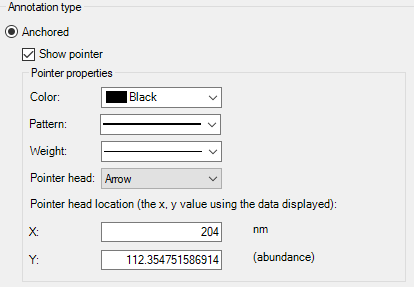
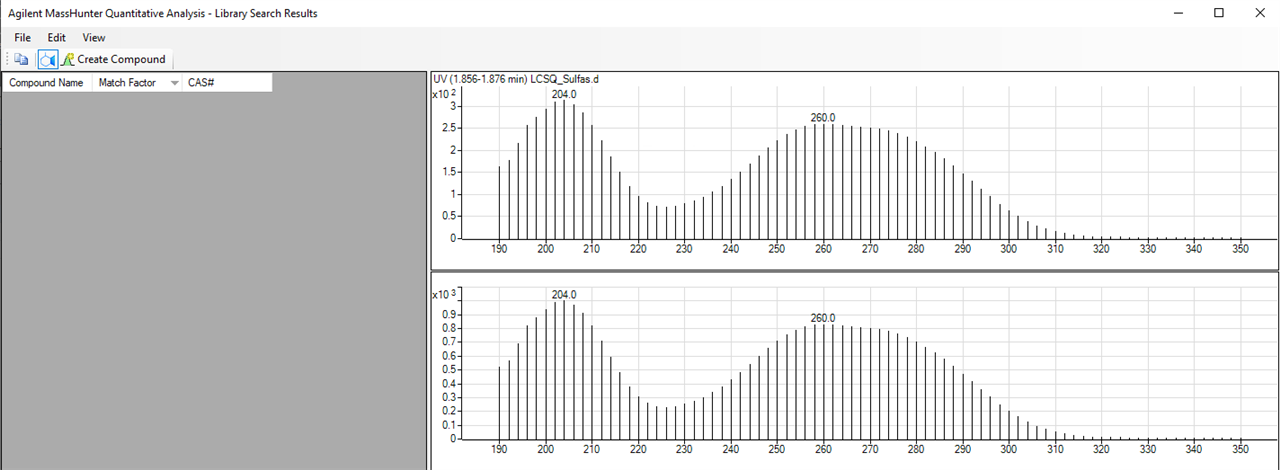
We are currently using LC-UV for quantitative analysis (until the QQQ can be validated) and I cannot see the UV spectrum in the Quant software.  Since we added a triple quad, we no longer have Open Lab to analyze the UV data.  Is there a way to see the UV spectra in the Quantitative software?  I can only extract the MS data but I need the UV data.  I know I can see UV data in the Qualitative software but that won't label my peaks or the UV maximas.   I think I can get UV data to print on the report if I add PeakSpectrum but the scaling is weird.  Any help would be appreciated.  Thanks!

Parents Reply
  •  ,

    By default, the spectrum is extracted as an average across the peak. The time range used is shown it the title for the spectrum. You can change this in the method editor under Advanced Tasks->Spectrum Extraction Setup. Spectrum Extraction Window can be set to Average or Apex.

    You can add the Spectrum Peak Height % Threshold column and change the setting here to only use points in the chromatogram that are above the specified percentage of the peak height. 

Children
Was this helpful?