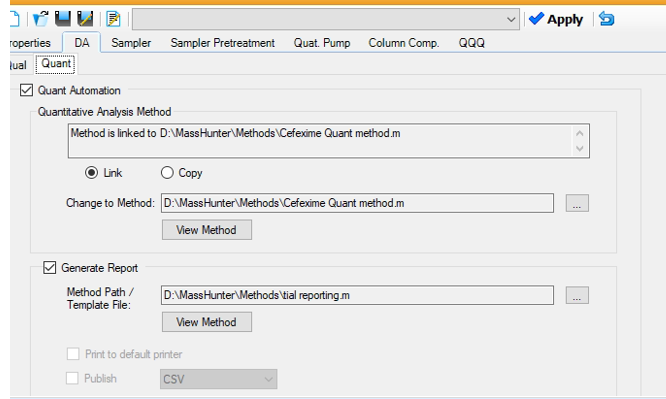
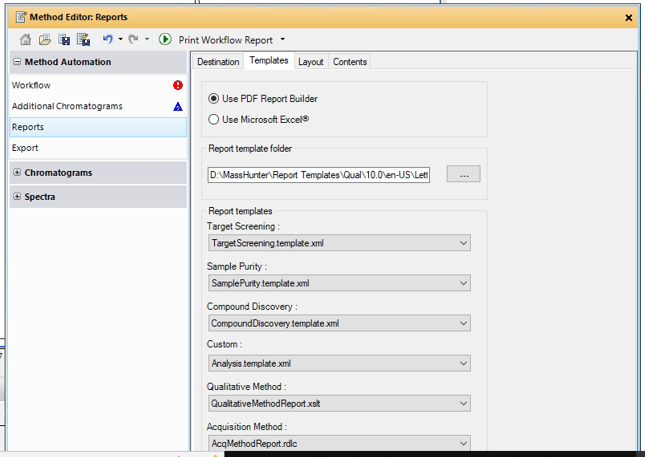
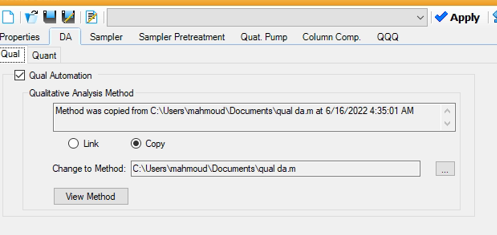
We are set up to analyze and print a report after each sample in our sequence. In preparing for this, we modified one of the included Excel templates and used MassHunter Quant to create a report method. When printed manually from Quant, the report shows everything as expected. However, when using automatic analysis and reporting in our sequence, the report doesn't contain the formatting we set in the report file (peak labels on the chromatogram). Also, the graphics files we set to be deleted after report generation are not being deleted. It appears that the report file we made is not being used. Our Excel template that we used for our report file and that we set in the sequence is definitely being used. I guess my question is how does automatic analysis/reporting know which report file to use? The report file does not seem to be referenced in the data analysis method (I searched the xml file for the report file name and it wasn't there), so not sure how this works?
Thanks!
-David


