For part of a report I am creating I would like to only show one graphic for each compound per sample. Is it possible to create a table where the next graphic is for the next compound and will terminate after going through each sample?
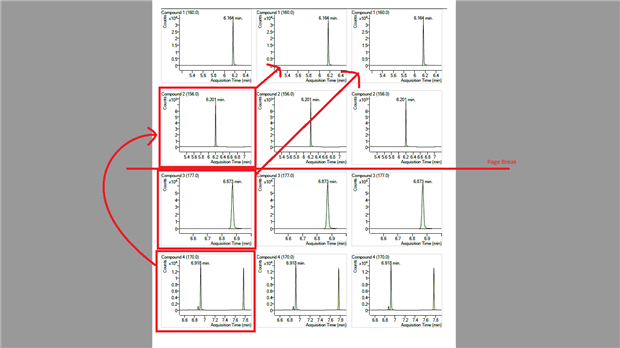
I tried to edit an image for an example with four compounds to explain what I am trying to go for. Instead of three graphics of the same compound in a row, I would like the second graphic in the first row to be for Compound 2 and the third graphic to be for Compound 3. Compound 4 would be bumped to the next row and would be the only graphic in that row. The page would break, and Sample 2 would continue in the same manner on the next page. In the end each page would have four graphics; three graphics on the first row, one graphic on the second.