Report Builder B.08.00 - Repeating Graphics For Different Compounds Across A Row

For part of a report I am creating I would like to only show one graphic for each compound per sample. Is it possible to create a table where the next graphic is for the next compound and will terminate after going through each sample?

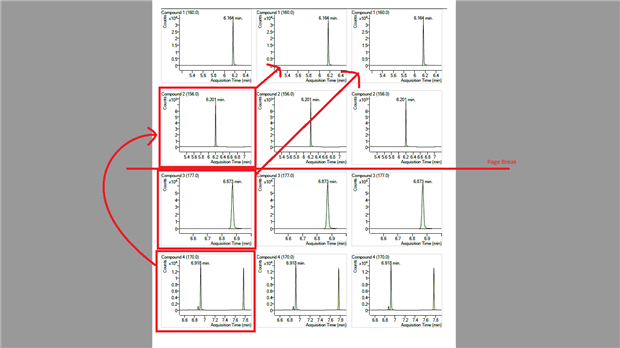
I tried to edit an image for an example with four compounds to explain what I am trying to go for. Instead of three graphics of the same compound in a row, I would like the second graphic in the first row to be for Compound 2 and the third graphic to be for Compound 3. Compound 4 would be bumped to the next row and would be the only graphic in that row. The page would break, and Sample 2 would continue in the same manner on the next page. In the end each page would have four graphics; three graphics on the first row, one graphic on the second.

Parents
  • There is a property called "Flow" that will do what you want that is found on the table as seen below..  False is the default but if you set it to True it will perform the "zig zag" pattern that you want.  Just place a single graphic in the table, it will not work with multiple cells (horizontal or vertical).  I am not sure this property is in B.08.00 so you may need to upgrade to Quant B.09. or better still Quant 10.0.


Reply
  • There is a property called "Flow" that will do what you want that is found on the table as seen below..  False is the default but if you set it to True it will perform the "zig zag" pattern that you want.  Just place a single graphic in the table, it will not work with multiple cells (horizontal or vertical).  I am not sure this property is in B.08.00 so you may need to upgrade to Quant B.09. or better still Quant 10.0.


Children
Was this helpful?