How to extract raw data from GCMS Masshunter

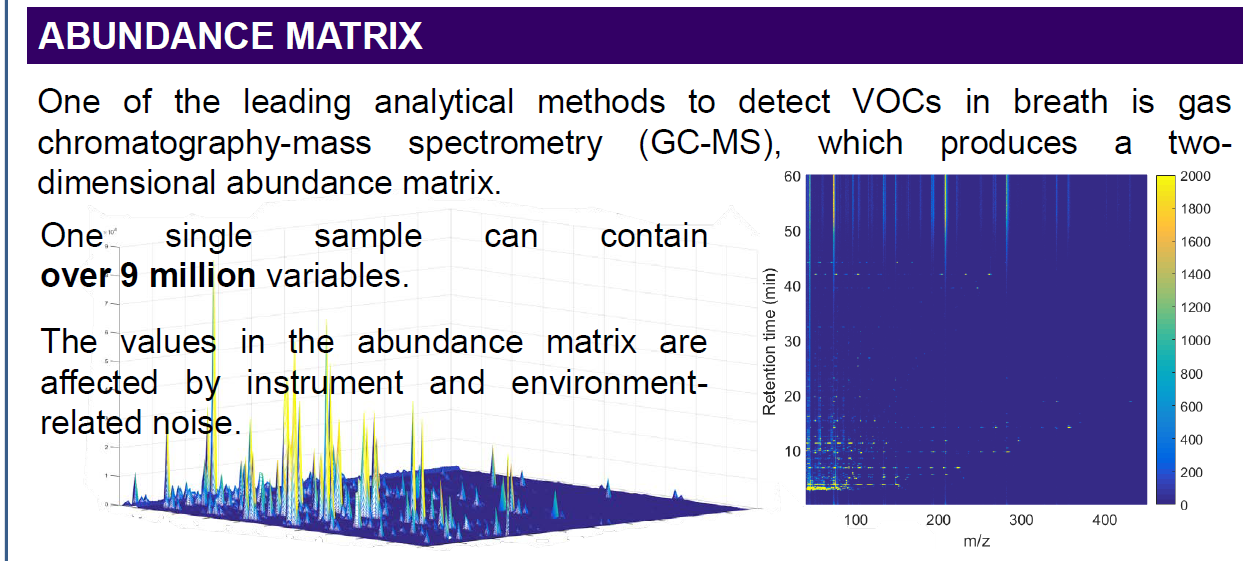
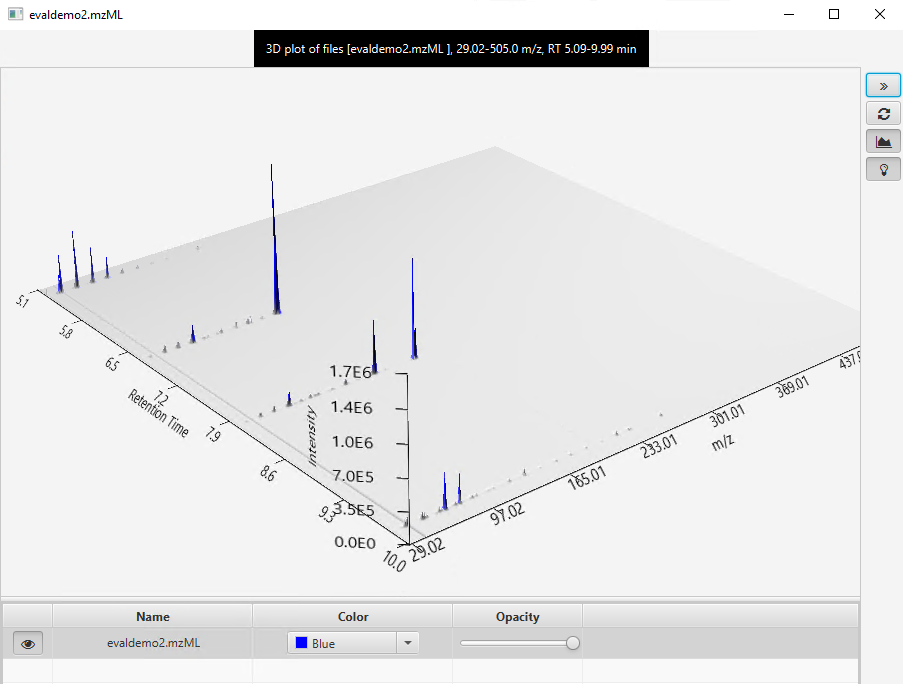
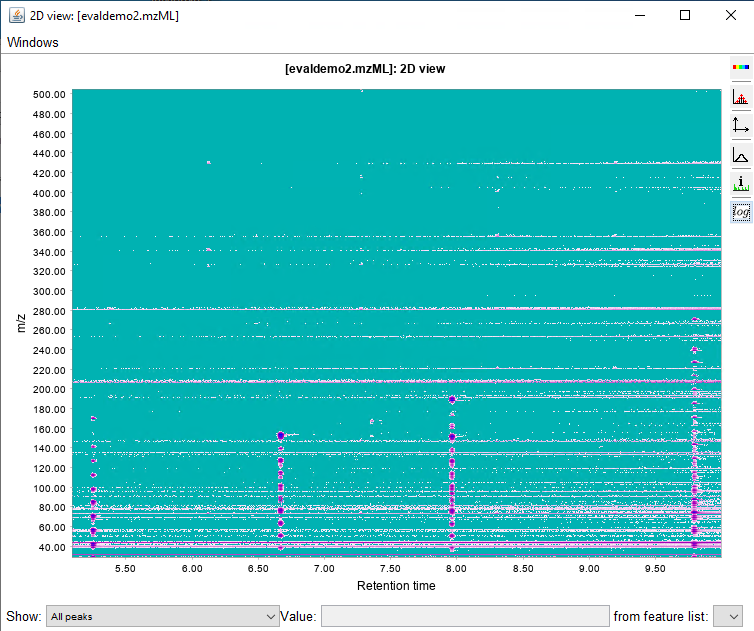
I would like to get the raw data from an unkown sample chromatogram which is in SCAN mode, so I can be able to build this 3-Dimensional plots, for example: In X axis there are all of the m/z values; in the Y axis the Retention Time and the results would show the intensity/abundance for every m/z in their respective RT.


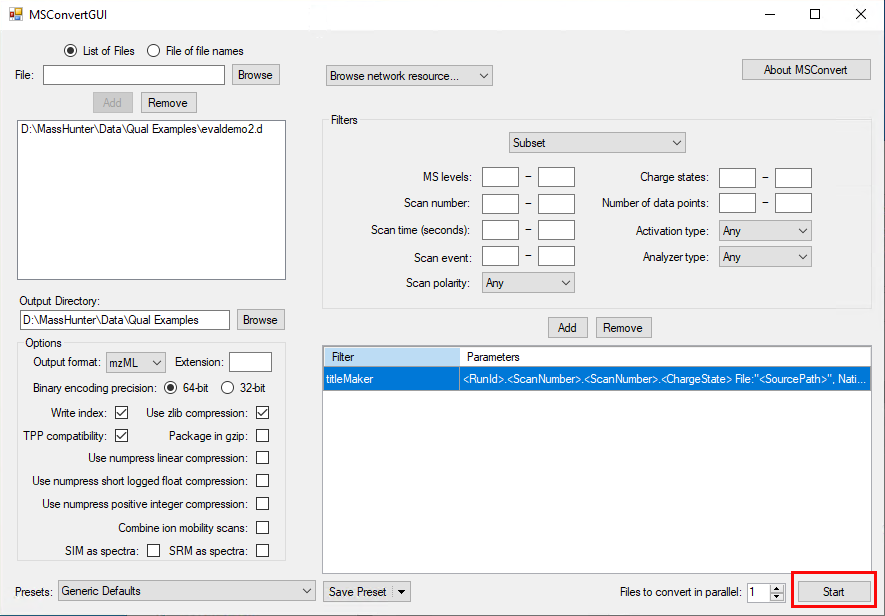
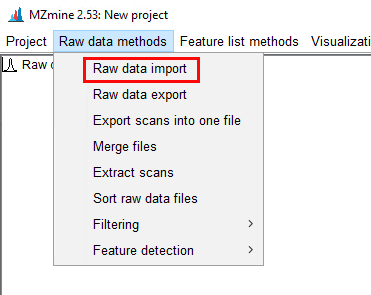
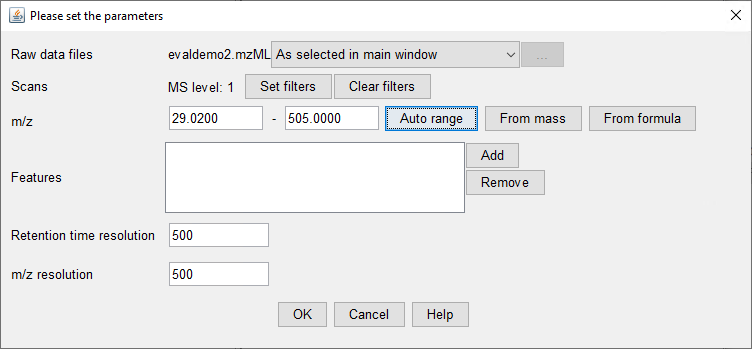
I want to know if this is possible using Data Analysis Software or Mass Hunter. Besides it would be helpful to get a step by step guide.


I really would aprecciate it!


Parents
  • Hi ,


    Neither classic MSD ChemStation DA nor MassHunter offer a way to create 3D plots. There are, however, a few different open source utilities and programs that people have used to successfully create such plots.


    As always with open source programs, these are not supported or endorsed by Agilent, but here are two programs I have been able to use to take MassHunter data and create 3D plots.


    The first one you need is ProteoWizard. It installs several different utilities. If installed with default options, you will now have a right-click option from File Explorer to open a data file in MSConvertGUI. 

    Once opened there, I made no changes to the default options. The output format needed for the next program is mzML, which is the default. Simply click the Start button to convert. 

    The next program needed is MZmine 2. Once extracted, run startMZmine-Windows.bat. Go to the Raw data methods menu, choose Raw data import and select the mzML file you just created.

    Then go to the Visualization menu and choose 3D visualizer. Enter the m/z range to plot or just click Auto range to plot the whole file.

    After clicking OK and adjusting the view a bit I have this 3D plot of the evaldemo2 data file


    You can also use the 2D Visualization and play around with settings to make something similar to the other plot.


    evaldemo2 is a pretty clean file so I had to adjust things quite a bit to make it look more 'interesting'. 


    This was all done with default settings and just clicking through things without checking the documentation. I imagine if you spend some time with these or other such programs you can probably come up with much better results than what I show here. But it at least shows it can be done.


    Both programs seem to have pretty active websites, so if you have questions about either program I would definitely check their support and documentation links. 

  • WOW, Howard! That explanation was truly awesome! Thank you so much! You went really beyond expected! ... I understand that MassHunter does not have the tools to make a 3D plot. But isn't there any options that export some kind of XML or TXT report with the raw data? Without analyzing data, just as it comes out from the MSD. Because I'm working with a Machine Learning Team, and there are going to be a big deal of samples to be analyzed, so basically I need a fast way to get the raw data and send them to them so they can input in the Machine Learning Equipment. Sorry if my english grammar is not the best. English is not my first language.

  • Thank you so much again Howard for your invaluable support! That helped a lot!

Reply Children
No Data
Was this helpful?