This is normal on this type of instrument. The chromatogram you have displayed is a TIC Total ion chromatogram or Total ion count. It is the sum of all the ions of all m/z that are detected. In LCMS there will always be ions detected, these come from sample, solvent background and your reference ions. Because of this, and unlike a UV detector for example, we cannot zero or balance the MS at the start of a run. You won’t really analyze the TIC, typically you will extract chromatograms for the m/z of interest EICs Extracted ion chromatograms) or the use one of the algorithms to mine compounds from the data eg Find by formula for targeted analysis or find by molecular feature for untargeted analysis.
What you see in qual is the ion count or abundance with Scale Chromatogram Off. The Scale to Largest in All Chromatograms plots everything as a % of the highest abundance in all your data.
If you extract a BPC, base peak chromatogram it might be more informative.
If you know what compounds you are looking for use Find By Formula or extract EIC Ion extracted chromtograms of the exact mass of the ion to 4 places.
Thank you for your response and information. It makes sense, maybe sample background is dirty or solvent.
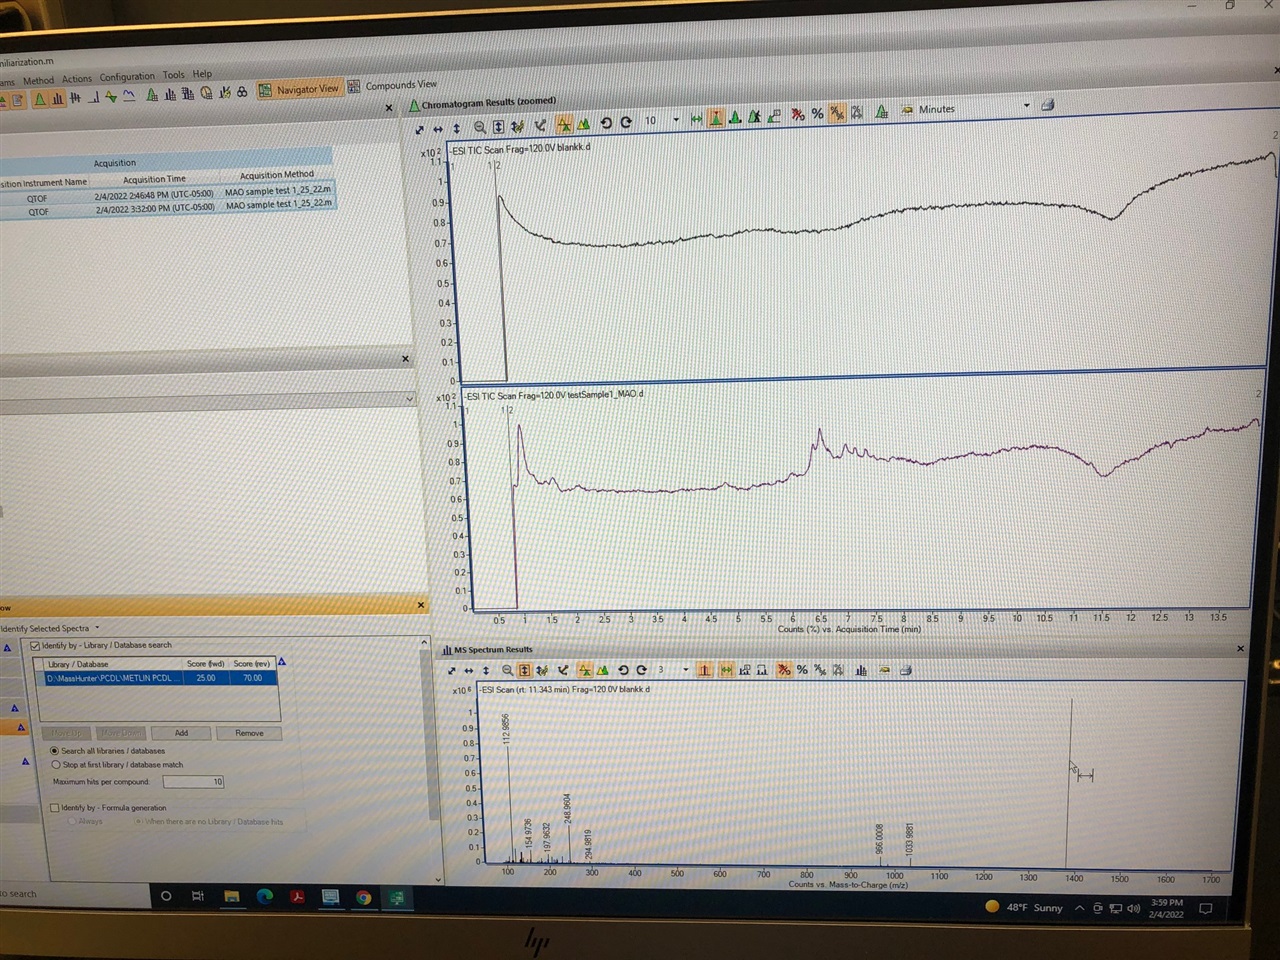
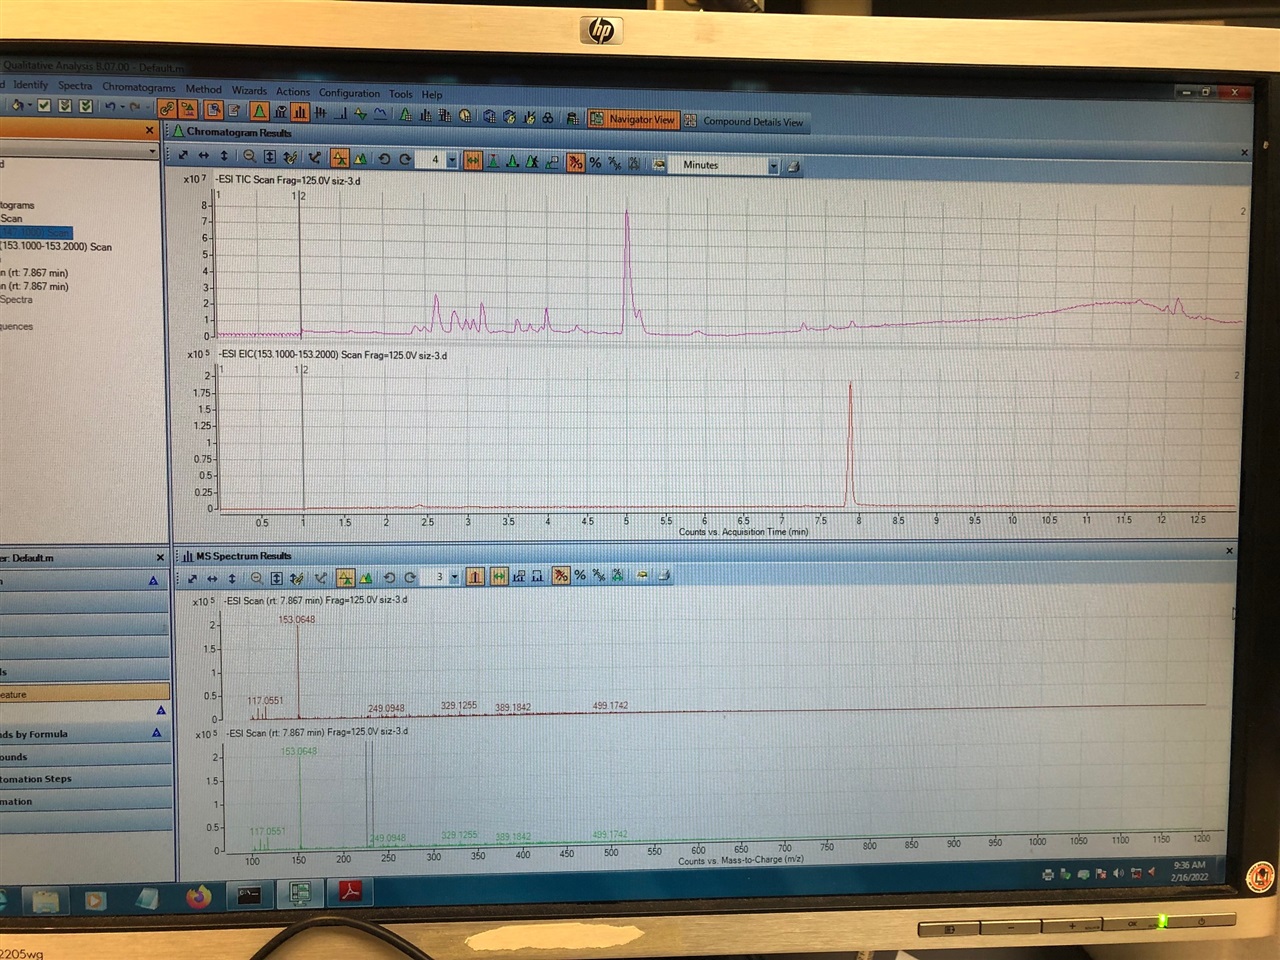
However, I have attached a TIC chromatogram from the old HPLC/QTOF in our lab and I like how the TIC chromatogram looks like. Then when I check for the EIC it shows up as nice sharp peak. When I look for EIC it shows nice peak too but I was just wondering how can I get nice TIC like as before with older instrument. Would it be the sensitivity for the new instrument that it picks up the background from sample or solvents? I want to mention that I ran this sample without reference ions checked and changed the solvents to the new bottles but not sure about the sample background? maybe need to filter or centrifuge more before run?
Look at the difference between the spectra in the background. It looks like the older system has a high background signal at m/z 112.9. I wonder if this system has been used with trifluoroacetic acid? That ion, in negative mode, might well correspond to residual TFA in the system!
I think you meant in the new system? The first chromatogram with high background is our new system. We have not used TFA in mobile phase or anything else, but added as reference solution, does it come from the reference?
Thank you Andy for your feedback and time. I am not sure about TFA in the solvent bottles but never had this problem in the beginning. The thing is, I can see other ions high too like 134.86 not only TFA! In the lower mass there was not such high background before on -ve mode.
We had the older HPLC connected to the new MS system though. Do you think this might have caused the background issue? like all the contamination come to the new MS? We just hooked up the new HPLC to the MS couple days ago and I see all these background getting worse now.
Have you managed to overcome the high background? I would probably look at using the Agilent flushing solution on the HPLC, to make sure that this is properly clean, if you are still struggling with high background.
No, I still see high background especially TFA mass. I will try that solution and was also thinking about changing the method. When the gradient goes to organic I see higher background!
Hi, Ross, thanks for your useful information. but I still confused about the TIC. I am working with PFAS based on LC/MS Aglient 1260, I also got a high peak at the 1 min in TIC chromatrograms for the balnk sample (pure methanol). I used the new column, purged the LC/MS, mobile phase is Water 10 mM Am-Ac and 80:20 MeOH:ACN10 mM Am-Ac. I ran ubder SIM mode.
so I wonder is the peak are led by those ions come out from the comlumn in 0-2 min also have the m/z value I set in the SIM acqusition method? The ions with its m/z not in the SIM acqusition method will not detected, right?
The QTOF doesn't really work like that. There is no SIM mode like in quadrupole instrument. It collects full spectral data all the time. The only slight advantage to collecting data over a narrower range is that data files are smaller. However, you need to ensure that at a minimum your mass range also includes your reference correction ions (usually 121 and 922). What you see early in the TIC is probably unretained material from your injection solvents or may just be as your divert valve switches from waste to MS at the time segment. (You can experiment doing no injection run or no switching to see which. (The divert to waste time segment at the start of a run can be useful for keeping unretained junk out of your MS). Its not likely something trapped on the column usually things that are trapped don't elute so early as they require the stronger mobile phase to lute them.
You don't really want to analyze your TIC. Unless this is interfering with compounds of interest I wouldn't be concerned by it. Collect the full data and then extract out chromatograms, Extracted Ion Chromatograms (EICs)of the m/z of interest (to 4 decimal places) or run find by formula algorithm (Targeted workflow) to find the compounds of interest. On a QTOF you effectively filter out the ions of interest in the data analysis stage. On a single or triple quad, you filter them out when you run the sample. Apart from the high resolution and mass accuracy, this is the other big advantage of the QTOF, you have the full spectral data so you can ask more questions from it later if you suspect maybe there was another compound of interest, for example.
If you want to see what ions are making up the early peak (Or any peak for that matter)
Walk the chromatogram
Look at the spectra in the preview pane
Any ions that are of interest you can highlight that range or (multiple ranges)
Right click> Extract EIC> At maxima in ranges
This will extract an EIC of the tallest ion in the selected range. I wouldn't do analysis like this, but it is a quick convenient way to see the profile of any ion over the course of your run.
We are glad this was helpful! We are sorry this was not helpful. If you still need assistance please create a community post or contact support. To help us improve, please provide any additional feedback.
For full details of how we will treat your information, please view our privacy policy.