


How to Create an Internal Standard Calibration Curve in OpenLab ChemStation
when you watch the video above, you will see the graphs in the below picture
my question is what causes the zigzag pattern, the pressure? 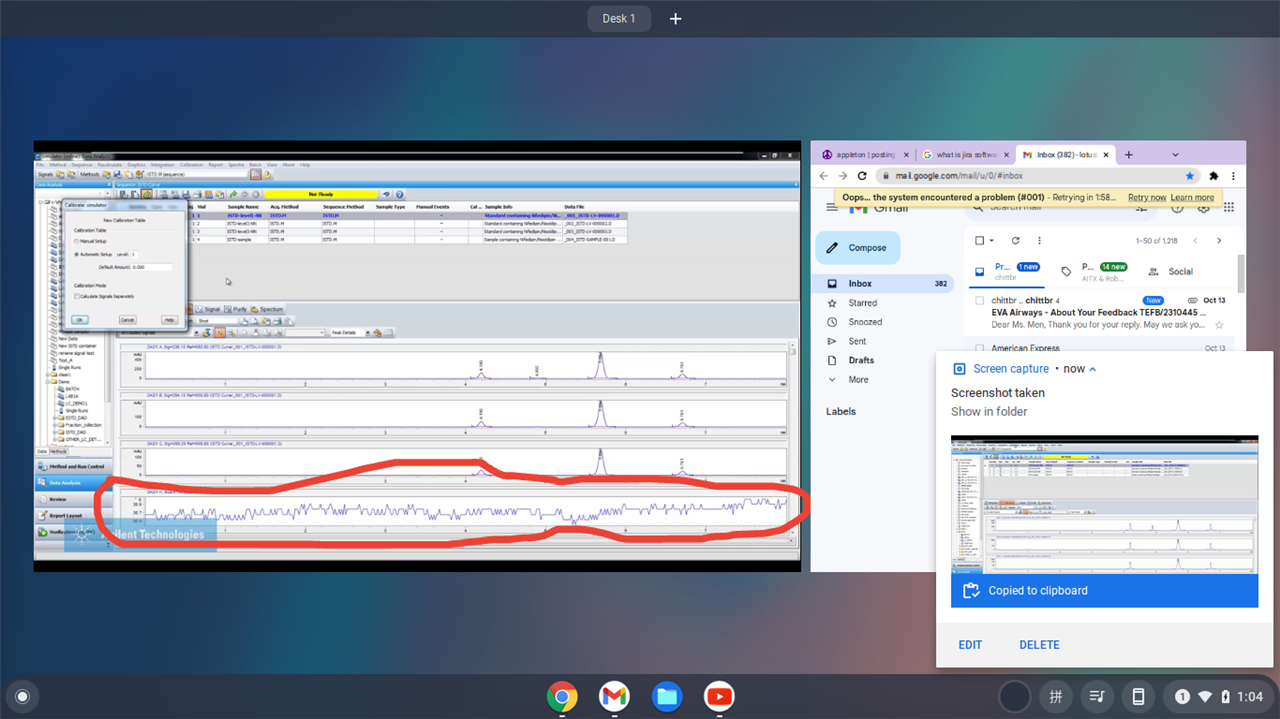
How to Create an Internal Standard Calibration Curve in OpenLab ChemStation
when you watch the video above, you will see the graphs in the below picture
my question is what causes the zigzag pattern, the pressure?


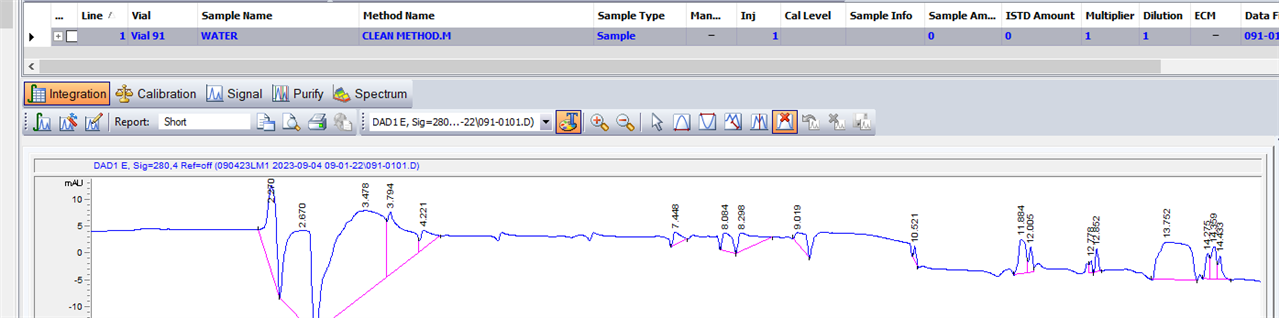
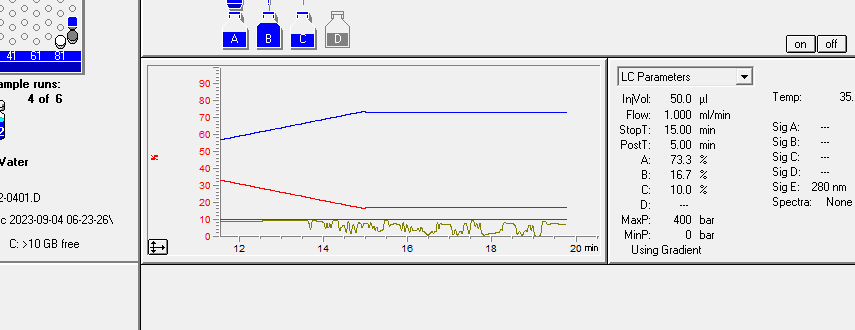
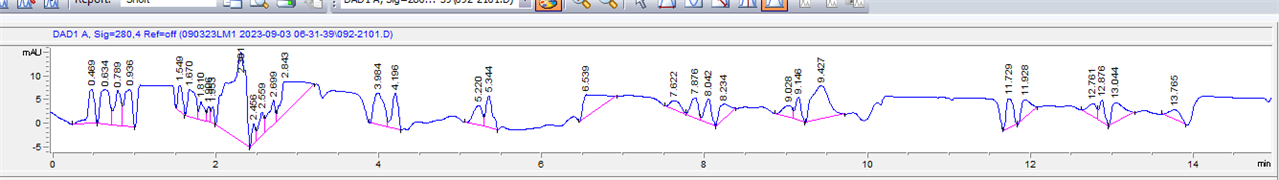
 I can't tell everything you are looking at. The window will tell you what the signals are and the ranges. Blue and red are pressure? and looks like it's in a run?