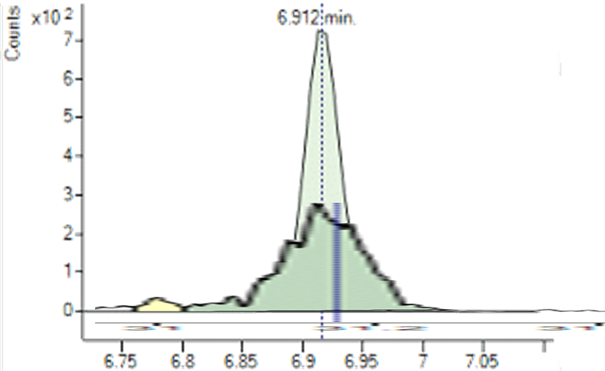
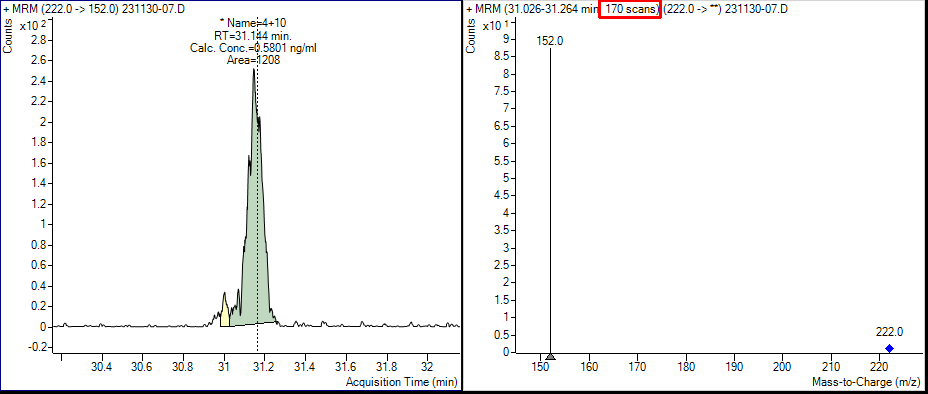
Our 7000A QQQ appears to have an issue with "spiky" peaks, even at moderate concentrations with reasonable area counts. Fig. 1 and 2 are an EIC of a PCB peak at 0.5 and 1 ug/L, respectively. I have included the spectrum to show the points per peak, these were collected in MRM mode (not dMRM) with a dwell of 25 ms. This "spiky"-ness observed affects integration significantly and stymies the Agile 2 integrator, even at concentrations as high as ~10 ug/L (Fig. 3). This requires manual integration to resolve.
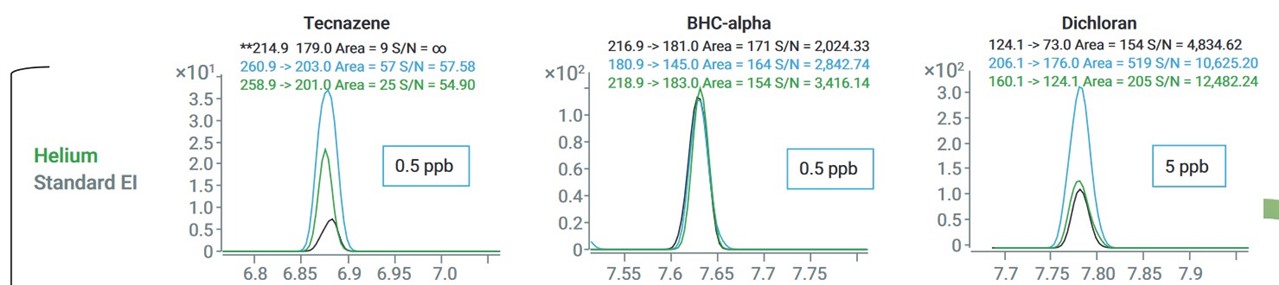
In contrast, I have observed in Agilent application notes peaks with areas < 1000 and sometimes even < 200 that do not display these issues, even with methods with purportedly over 50 concurrent transitions (with dwell times likely less than 25 ms shown here). Examples of these peaks can be found in the Appendix Figure 1. of note 5994-6505 (link) and Figure 3. of note 5994-4891 (link).
I would think that if smoothing were used to produce the chromatograms it would be mentioned in the application notes (no smoothing mentioned in either of the two examples), so I think that can be ruled out. I have experimented with the "baseline subtraction" and "advanced filtering" settings in MS parameters with no changes. Different gain levels have been tested as well.
What would cause this? Our instrument has no observable issues and no tune errors to note. We are using a relatively new EI extractor source and the EM is in good shape, tune value is around 1200 V. Any ideas would be greatly appreciated. Thanks!
Fig. 1 Manually integrated 0.5 ug/L PCB standard. 1200 area count.
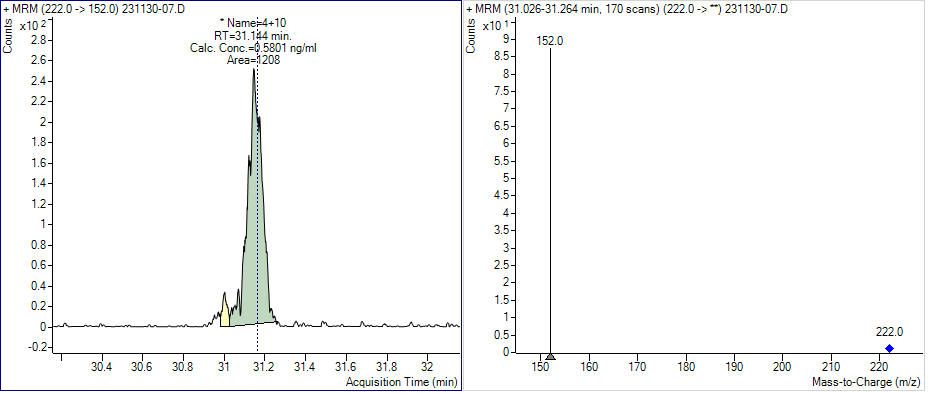
Fig. 2. Manually integrated 1 ug/L PCB standard. 2200 area count.
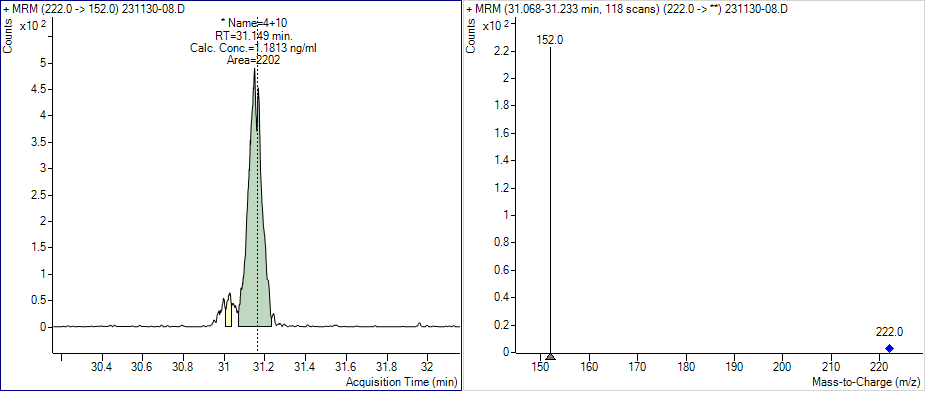
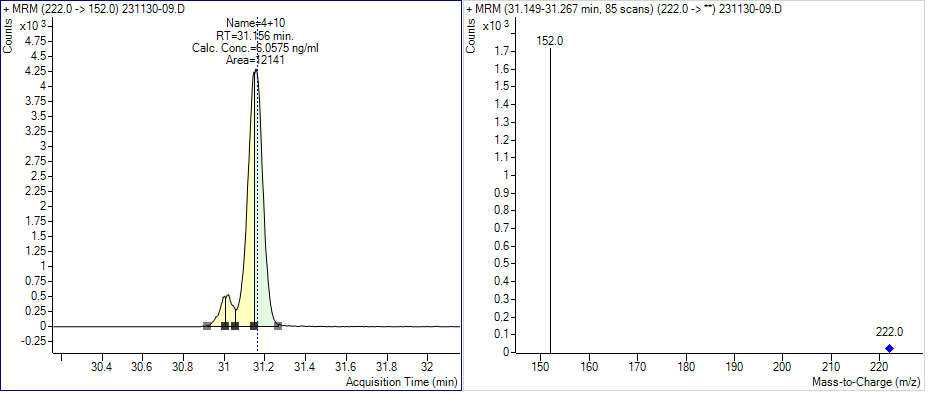
Fig. 3. Non-manually integrated 10 ug/L PCB standard. Note false peak splitting caused by "spiky" peaks. Area count and no. scans in the figure are inaccurate as the peak is not correctly integrated.

 '
'