Wax Column Peak Doubling

Hello, 

I am having a very strange problem with some analytes I am dealing with. The system I am using is an Agilent 8890 GC with a 7000D mass spectrometer. The injector is from Gerstel and consists of a thermal desorption unit (TDU2) and a cooled injection system (CIS) which is basically a PTV inlet. The column is a StabilWax-MS from Restek. The sample types are foods and we are analyzing flavor and fragrance compounds. 

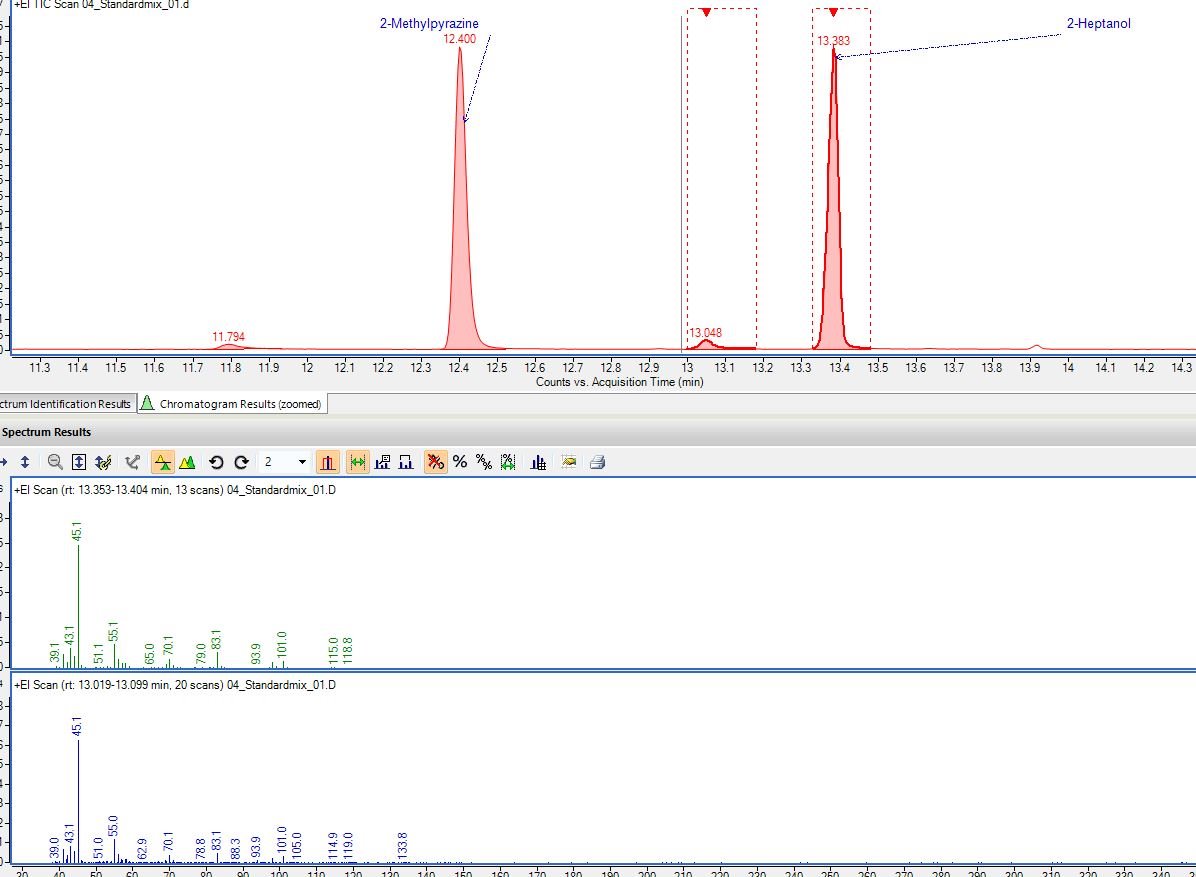
While running a variety of samples I noticed peaks doubling. Some analytes were showing up twice at about ~0.5min-1min apart. Here are some images that illustrate the problem in a standard mixture. 

Here is the standard mix. 

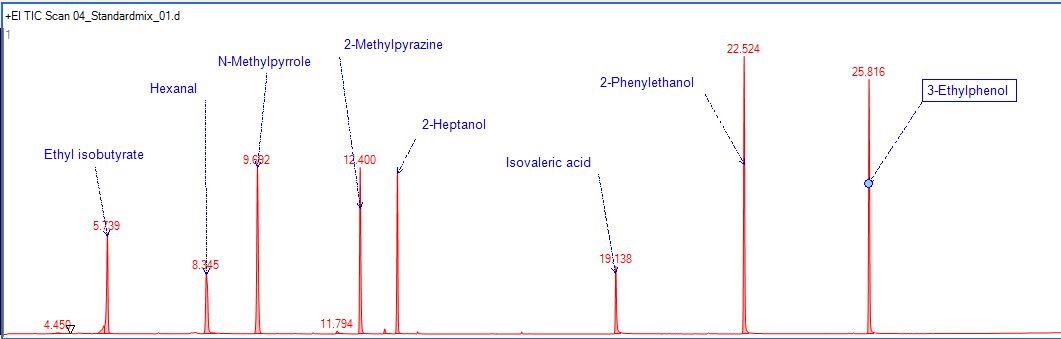
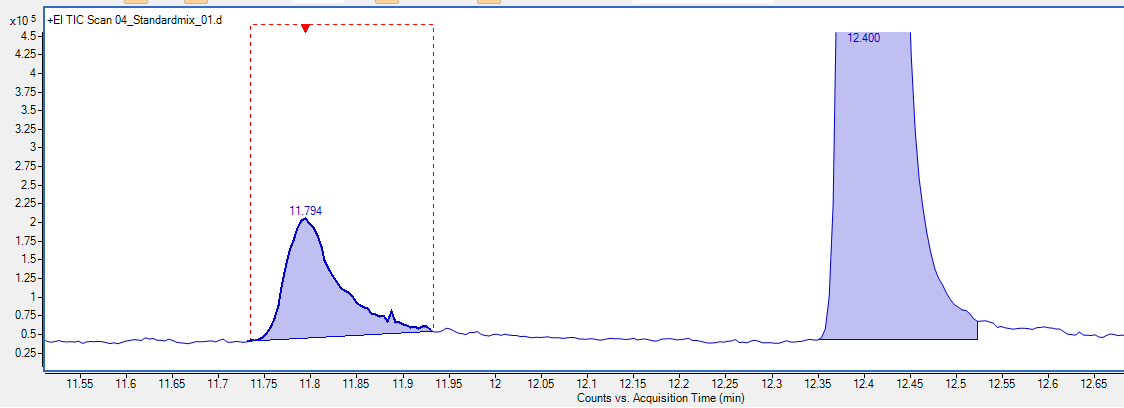
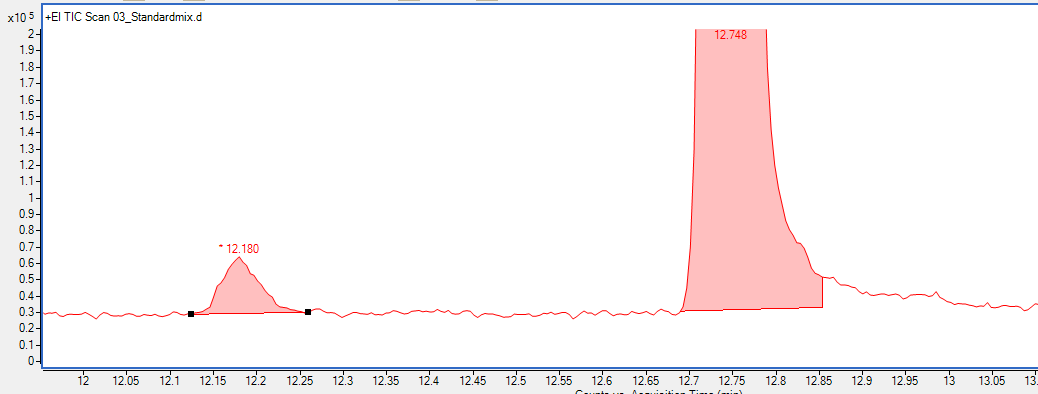
Peaks look normal except if you look closely two of the peaks are 'doubling'. Specifically 2-methylpyrazine and 2-heptanol. 

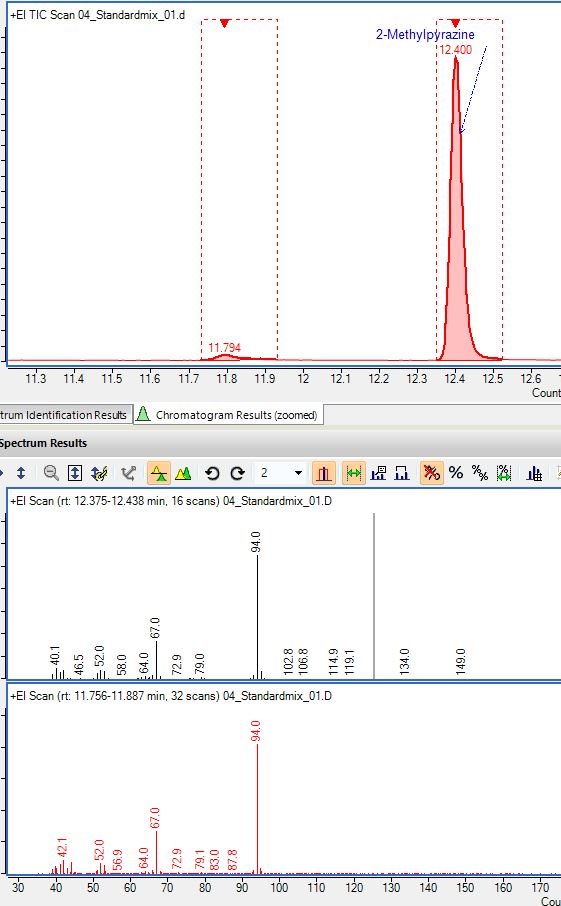
These compounds didn't do this before and this problem only started happening after I had evidence of a contaminated inlet/column. I changed liner and problem went away temporarily but came back after running some samples and then checking standards again. Clipping column similar issue. So I replaced the whole column and I am in process of testing if that was the problem. Has anyone ever seen anything like this before? I don't have a lot of experience with Wax type columns but this behavior is something I've never seen before. It could be an issue with TDU/CIS and I'll know more after testing new column. Its just so strange to only be occurring with certain compounds. I was seeing a similar phenomenon with real samples and it was making data processing extremely confusing. 

  • This is more than likely inlet/sample introduction related and not the column. Column problems typically result in peak shape issues and not 20 to 36 seconds between peaks of different sizes.

    How big are the peaks in Scan mode - what abundance?  What is your scan threshold?  Do you get any peaks running a blank solvent injection?

  • Hello, 

    Thanks for your reply. Yes I agree that it would be weird for the column could cause this. Usually peaks broaden and exhibit weird shapes or split a bit. I changed column as a last resort / sanity check. Note column is wax column and it was getting older / had been through some abuse. 

    This is full scan mode. Scan range 35-350amu. Scan threshold is 0 (maybe I want to increase that at some point?). Blanks are very clean (especially after doing all this maintenance and rigorously troubleshooting for potential sources of contamination). No carryover has been observed during this testing and isn't normally an issue with sample analysis. Note I am using a thermal desorption unit (TDU from Gerstel) with a cooled injection system (CIS4 from Gerstel, essentially a PTV inlet) as injection / inlet. The TDU/CIS has a lot that can go wrong compared to a normal split/splitless inlet. Thermal desorption tubes / adsorbents are also potential sources of contamination / problems. I've ruled out adsorbents and thermal desorption tubes as issue. This all started after running fatty food samples at somewhat higher then recommended temperatures likely loading contaminants onto liner / beginning of column. However, initially the problem resolved after liner change but quickly came back when I was doing more method development on the difficult sample type.  

    Here is an example for 2-methylpyrazine in the same standard mix before and after column change. This is similar change I've seen when changing liner. Meaning bigger 'double' peak before changing liner (when it was obviously contaminated) versus after changing. Sometimes it goes to zero and there is no double peak at all which is how it should be and how it used to be before this problem started. 

    Small 'double' peak before changing column was 3% (peak area: 642848.38) relative to main peak (peak area: 22204619.8)

    Small 'double' peak after changing column is 0.5% (peak area: 94081.87) relative to main peak (peak area: 19398497.65). Ignore retention time shift this is due to different column. 

Was this helpful?