


What could be causing the appearance of that ghost peak?
Analysis on a GTA120 240Z AA
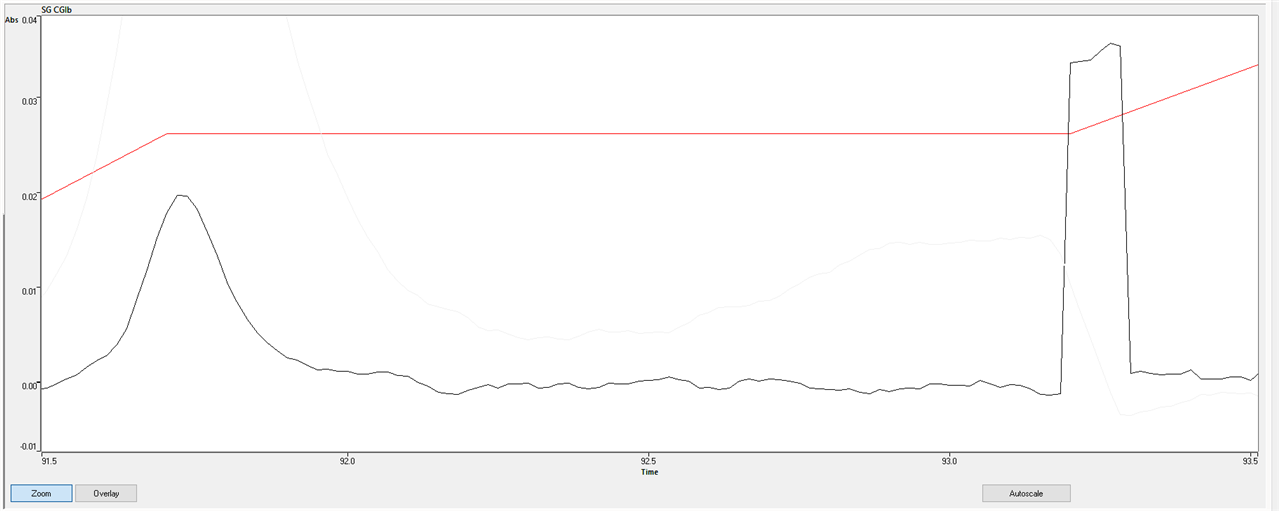
The peak on the left is the peak of interest; the peak on the right is the ghost peak
Analyzing Lead in Blood, I get a graph like the previous one and I have discovered the following:
-
The ghost peak is independent of the temperature program. Whether the program is shortened or the Storage and Read sections are modified (in order to visualize and read only in the time range where the peak of interest is observed).
-
The ghost peak is observed in both the standards and the samples.
-
The ghost peak appears at the same time where the flow stops from 0 to 0.3 L/min. The time it appears is constant, but the intensity may vary and it appears as a horizontally cut peak when using Zeeman, and as a full peak when using only graphite furnace analysis.
-
The error or flag that appears is a letter "a" next to the concentration, the average absorbance, and the background absorbance. It also appears as W0557 "signal overrange".
-
In the case of the standards, all the replicas are analyzed, regardless of whether there is one or more replicas out of range.
-
In the case of the samples, it was detected that all the replicas are analyzed as long as the first replica was not out of range. If the first replica was out of range, subsequent replicas will not be analyzed.
-
Analyzing without samples or solutions, the peak still appears.
-
In one test, the air conditioning was turned off to see if it caused a draft to the furnace or the windows, but the peak still appeared on the graph.