We are running a series of dilution studies on our ICP-OES 5110 (Intelliquant Software Version 7.6).
We want to determine the dilution factor that offers the most reliable results for each one of the samples from our plant.
One dilution study was done with Tin (Sn) Standard from Ricca Chemical Co. 1000.0 ppm +/- 7.2 ppm (Matrix: 1% HNO3, 1% HF), used as our testing probe.
Testing procedures. Five dilution samples were prepared (digital pipette used for precise volume) and tested, using the Tin Standard.
Dilution Factor 1: 12 mL of Tin Standard + 0 mL of 1% HNO3
Dilution Factor 2: 6 mL of Tin Standard + 6 mL of 1% HNO3
Dilution Factor 3: 4 mL of Tin Standard + 8 mL of 1% HNO3
Dilution Factor 4: 3 mL of Tin Standard + 9 mL of 1% HNO3
Dilution Factor 5: 3 mL of Tin Standard + 12 mL of 1% HNO3
ICP-OES configuration: Radial View, RF Power 1.2 kW, all other parameters set to standard. Tin wavelength 189.925 nm.
Results:
| Sn | RADIAL | 189.925 | 189.925 | ||
| Dilution | Factor | Analyte | 1% HNO3 | Concentration | Intensity |
| (mL) | (mL) | (ppm) | (ct/s) | ||
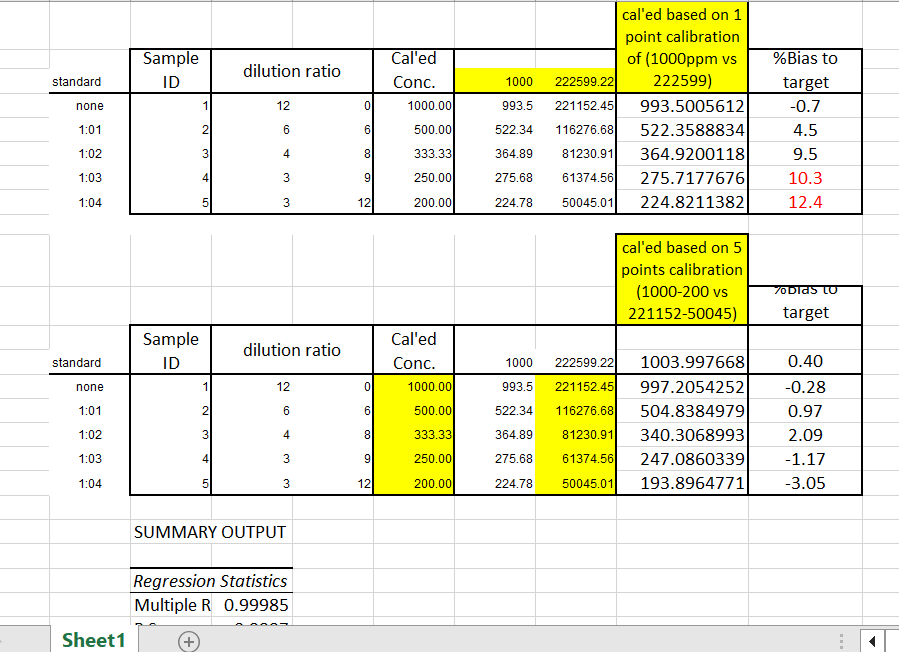
| blank | 0.00 | 11.12 | |||
| Sn standard | 1000.00 | 222599.22 | |||
| none | 1 | 12 | 0 | 993.50 | 221152.45 |
| 1:1 | 2 | 6 | 6 | 522.34 | 116276.68 |
| 1:2 | 3 | 4 | 8 | 364.89 | 81230.91 |
| 1:3 | 4 | 3 | 9 | 275.68 | 61374.56 |
| 1:4 | 5 | 3 | 12 | 224.78 | 50045.01 |
What should it be the relationship between the Intensity (Concentration) vs Dilution Factor?
We have found a power relationship between them. Shouldn't it be linear?
Appreciate any ideas or comments. Thanks.