What should a typical intensity peak look like?

A bit of background information; analysis is for Au using typical fire assay methods to prepare the sample (so sample should be relatively free of interferences), as well as typical nitric/hydrochloric digestion. Calibration standards are certified Au only, 12.5% acid matrix.


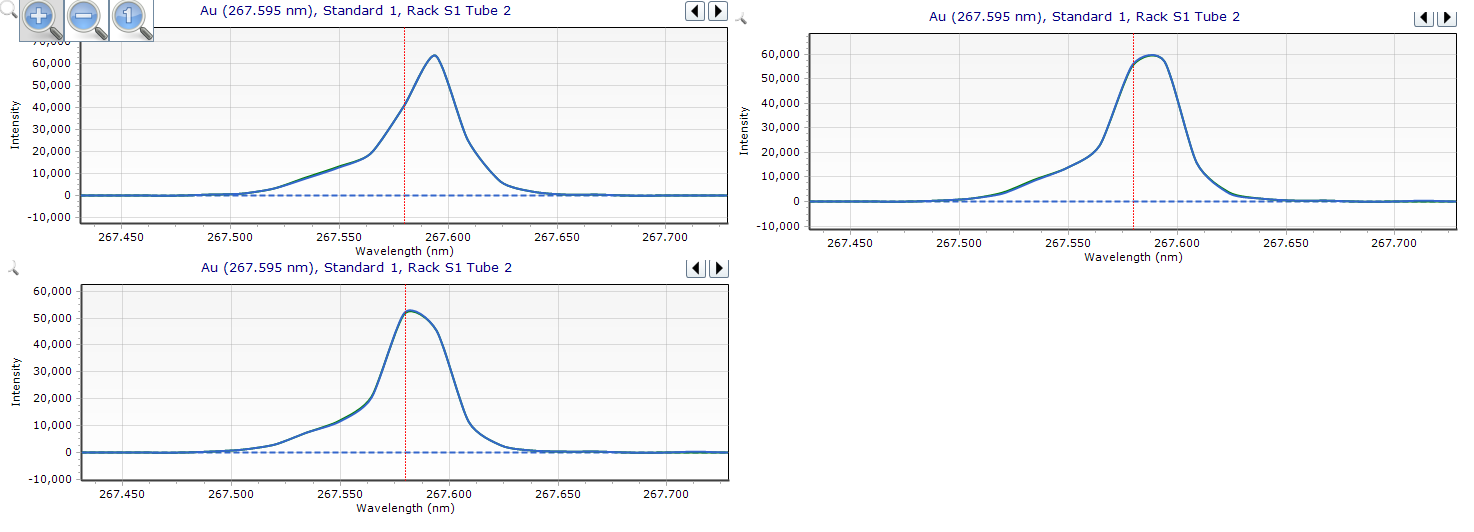
Now to the question, what should a typical intensity peak look like? Sometimes I notice the peak is wide and round, sometimes the peak leans to the left or right, and sometimes the peak is narrow and pointed. Wavelength calibration has been done, torch is clean, lens is clean, and the same nebulizer flow/viewing position was used for each read. I've attached an example of what I've described. These are from a 5ppm Au standard.


Is a specific shape of intensity peak indicative of anything? Does it have any effect on the overall analysis?


I'd be very grateful for anyone's input!

Parents
  • Hi,


    The peak shape is not always symmetrical, but if the peak shape is symmetrical for the single element solution as compared to the blank matrix solution, then it is likely that you can confirm that the peak shape is only from the Au.

    it´s more interesting if the peak shape of the samples is very different compare to the single element due to interference. 

    Most of the time the correction technique in the software like "Auto" or "FLIC" could correct for different peak shapes (interference). but it´s a good practice to compare the different lines during the analyses to identify interference. 


    cheers,

    edgar

Reply
  • Hi,


    The peak shape is not always symmetrical, but if the peak shape is symmetrical for the single element solution as compared to the blank matrix solution, then it is likely that you can confirm that the peak shape is only from the Au.

    it´s more interesting if the peak shape of the samples is very different compare to the single element due to interference. 

    Most of the time the correction technique in the software like "Auto" or "FLIC" could correct for different peak shapes (interference). but it´s a good practice to compare the different lines during the analyses to identify interference. 


    cheers,

    edgar

Children
No Data
Was this helpful?