Intensity issues for standard blank during the first calibration

Hi everyone : We use an ICPMS 7800 and, before and after the first standard calibration, the signal intensity vary a lot.

The intensity for most of the elements tracked decrease strangely, even if we take care of cleaning the autosampler probe with washes before and after the calibration.

  • Matrix of Standards : 2.7% v/v HNO3
  • Matrix of wash ("Rince pre-std", "Diluent Blank") : 2% HNO3, 0.5% HCl

As you can see on the screenshot below, the intensity for the same solution can vary from single to double. On the same note, the intensity of the wash before calibration decrease slowly for most elements tracked, even with 10 washes. As a result, all the blanks following are negative until the next recalibration.

 (knowing that we leave the ICPMS warm up 20 minutes at its start, before doing the performance report, a tune of the instrument, adding the internal standard line and 10 minutes of wash again, so the ICPMS is turned on for approximately an hour before the "Rince Pre-Std".  We wash it as well at the end of each analysis with a dedicated wash solution, according to Agilent advises.)
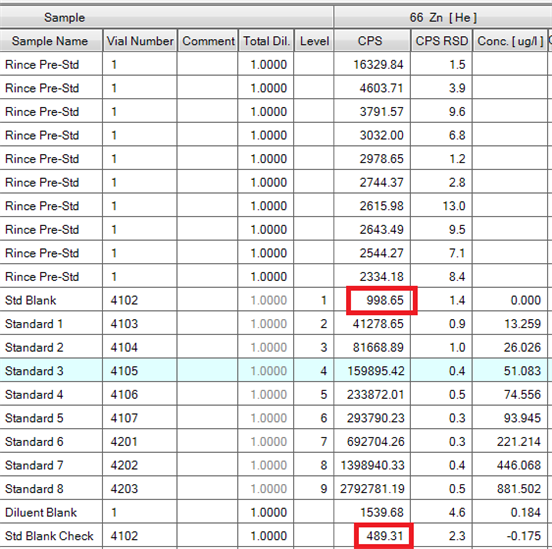
do you have any idea what could happen here? Thanks!

Parents
  • Hi,

    We see this issue with decreasing Zn counts over the run and it seems to originate from inadequate rinsing of the sample introduction (primarily the peri-pump tubing) in the sample/calibration matrix prior to calibration.  If we run, the same sequence immediately after the first run, oftentimes that will resolve the Zn issue.  Obviously a more efficient way to handle this would be to find a better rinse protocol prior to the run.

    From the data you provided, it looks to me like Zn is rinsing out of your sample/standard path.

  • Thank you for your answer about the contamination evidence : I think you spotted what happens. But, as I explained in my original post, these results were obtained after an acid-clean of most of the volumetrics, bottles and autosample wash reservoir included, so I have difficulties to figure out where the contamination come from.

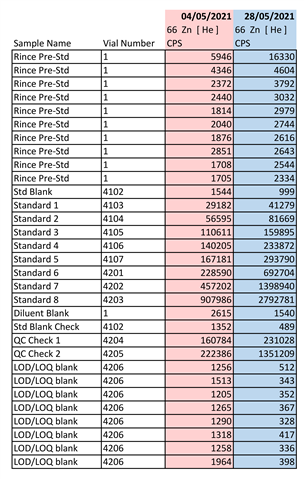
    Moreover, as you can see in the results attached to this post: it's mainly the standard blanks that came out lower from this care (analysis 28/05/2021 in blue) compared to former analysis (4/5/2021 in red). The non-sample/standard path seems to show the same kind of contamination, acid wash or not.

    I think I have to try different path of wash (including a 'direct' one, peripump capillar straight into the solution) to spot the source of the contamination : thank you again to have suggested it.
    (EDIT: a PM and change of cones was performed during the 2 analysis, so the intensities are not quite comparable unfortunately.)

Reply
  • Thank you for your answer about the contamination evidence : I think you spotted what happens. But, as I explained in my original post, these results were obtained after an acid-clean of most of the volumetrics, bottles and autosample wash reservoir included, so I have difficulties to figure out where the contamination come from.

    Moreover, as you can see in the results attached to this post: it's mainly the standard blanks that came out lower from this care (analysis 28/05/2021 in blue) compared to former analysis (4/5/2021 in red). The non-sample/standard path seems to show the same kind of contamination, acid wash or not.

    I think I have to try different path of wash (including a 'direct' one, peripump capillar straight into the solution) to spot the source of the contamination : thank you again to have suggested it.
    (EDIT: a PM and change of cones was performed during the 2 analysis, so the intensities are not quite comparable unfortunately.)

Children
No Data
Was this helpful?