Can I measure the average value of a signal in OpenLab CDS V2.7

Hello community!

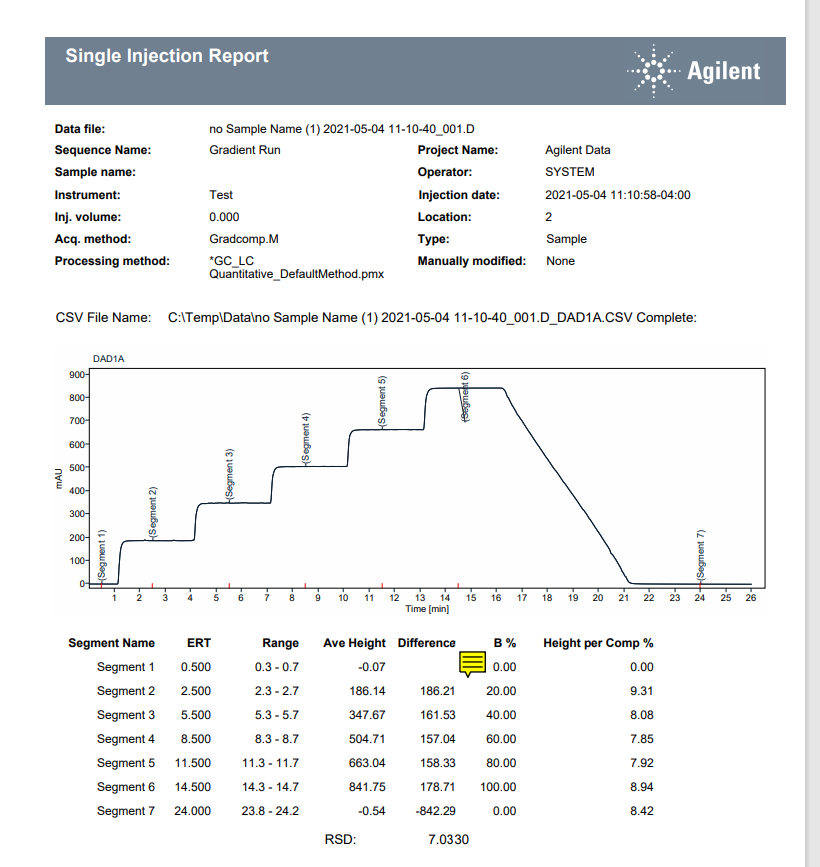
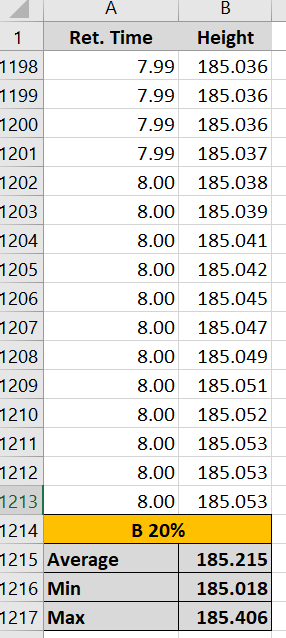
I want to be able to calculate the average value of a particular signal.  The signal is essentially background, no peaks, just a bit of elevated background signal.

Is there a way to do this directly in OpenLab Data Analysis?

My current solution is to export the signals using the Post Processing option to export csv files and do the work offline, in Excel.

/Andy

Parents Reply Children
  • Hello Marty,

    I see.
    At the moment I do export of the chromatogram to csv. Than I open it using excel and manually select time range to calculate average, max and min values for height over specific time range. In my case in the range from 7 to 8 min I have 1212 data points. I would like to do it automated.
    Unfortunately, I am not familiar with VB and can’t find how to write a correct expression for calculation of average, max and min height for a specific time range. Could you please advise an example of expression for such calculations that can be added to a report.
    =Peak_RetentionTime( from 7 to 8 min) _avg(Peak_Height)
    =Peak_RetentionTime( from 7 to 8 min) _min(Peak_Height)

    Thank you in advance.
    Kind regards,
    Rustam

  • Hello,

    There is no simple expression to calculate those values in IR as it has no access to the raw data points. I my example, I wrote and complied a custom dll in VB with functions that could be called in an IR template to read in the exported CSV and then do the requested calculations from the raw data. As the template and custom code was part of a on demand solution project, I cannot share it. If you need something like this done and do not have access to any programing resources, you can ask your local Agilent sales about quoting custom solutions. 

    Marty 

  • Hello Marty,

    Thank you very much for your feedback.

    Kind regards,
    Rustam

Was this helpful?