Report Builder Concentration Issue

I am having some issues getting report builder to show Calc Conc. and Accuracy correctly when I have Calibration data bindings present.

I am using the Gen_Calibration template. I added the following data bindings so that I could add the Accuracy and Calc. Conc. columns to the data table:

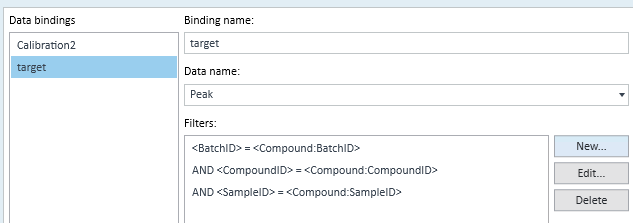
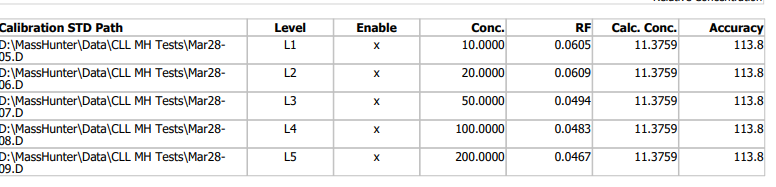
However, when I preview the report, the Calc. Conc. and Accuracy columns seem to only be pulling information from the first calibrator sample L1.

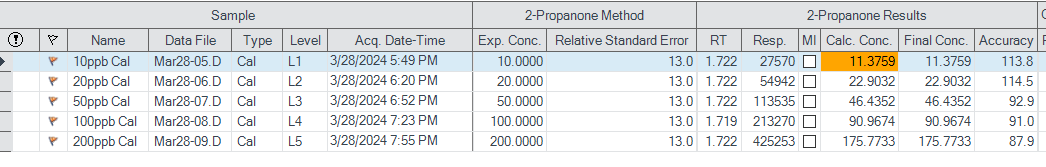
The accuracy is calculating fine in Quant:

Any assistance would be appreciated! This is my first attempt with report builder, so I'm pretty clueless!

Parents
  • Hello  ,

    The calibration table is stored in only one sample in the batch. This is why you keep seeing the same accuracy since this is stored in the peak table.

    Unfortunately, it would be very difficult to come up with a Report Builder binding that would successfully combine the information in the calibration table with that from the peak table. The only way that I can think of where it might be possible would be to utilize some unused or hidden cells as described in this post.

    (12) Add statistics (mean, stdev) for a column in MassHunter Report Builder - Forum - Mass Spectrometry Software - Agilent Community

    You would have to set up your own data structure in Python, maybe a dictionary (see 5. Data Structures — Python 2.7.18 documentation), associate the data file name with its accuracy using a hidden list or table, and then access that data structure in your calibration reporting section, since you do have access to the data file name in the Calibration Std Path Name in the calibration table. I can't say for certain this would work, and I have no examples. 

    There are enhancement requests to have the accuracy information more readily assessable from the calibration table in Report Builder but there is currently no timeline on when this might be implemented.

    The easiest way to report accuracy in the calibration table is to utilize the Software Development Kit (SDK) and create a Python based report template.

Reply
  • Hello  ,

    The calibration table is stored in only one sample in the batch. This is why you keep seeing the same accuracy since this is stored in the peak table.

    Unfortunately, it would be very difficult to come up with a Report Builder binding that would successfully combine the information in the calibration table with that from the peak table. The only way that I can think of where it might be possible would be to utilize some unused or hidden cells as described in this post.

    (12) Add statistics (mean, stdev) for a column in MassHunter Report Builder - Forum - Mass Spectrometry Software - Agilent Community

    You would have to set up your own data structure in Python, maybe a dictionary (see 5. Data Structures — Python 2.7.18 documentation), associate the data file name with its accuracy using a hidden list or table, and then access that data structure in your calibration reporting section, since you do have access to the data file name in the Calibration Std Path Name in the calibration table. I can't say for certain this would work, and I have no examples. 

    There are enhancement requests to have the accuracy information more readily assessable from the calibration table in Report Builder but there is currently no timeline on when this might be implemented.

    The easiest way to report accuracy in the calibration table is to utilize the Software Development Kit (SDK) and create a Python based report template.

Children
No Data
Was this helpful?