Rapidly export area counts for multiple EICs?

Hi all,

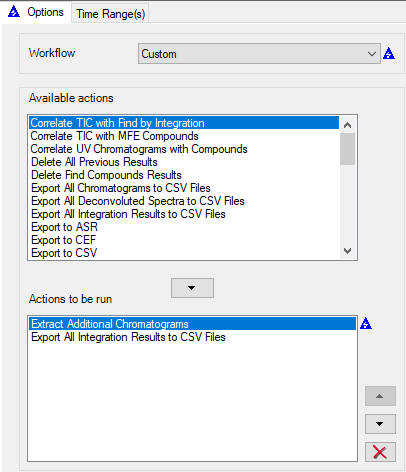
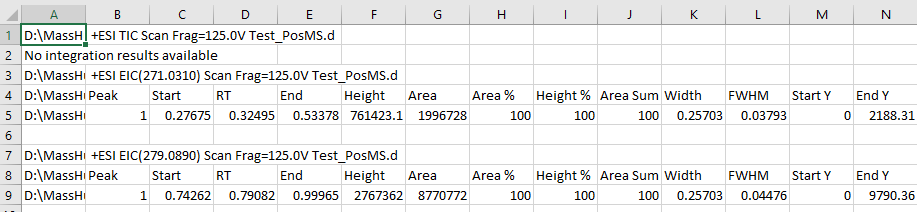
I am a graduate student working in a bio-analytical lab and I routinely analyze the data we acquire from our 6530 in Qual, and I was wondering if there was a way to rapidly export integrated peak areas from multiple EICs into a .csv or Excel file. I currently go through and tabulate each one at a time, and this is quickly becoming far too time-consuming. I have tried to find some way to export several peak areas from Qual, but have not identified a streamlined method that will do this. Similarly, I have tried to get this to work in Quant, but I am having an extremely difficult time understanding how to use this particular software.

Does anyone have any suggestions to accomplish what I am trying to do? Any advice would be greatly appreciated.

Parents
  • Hello  ,

    If you are extracting EICs in qual and want to export the results you can make a custom workflow to extract additional chromatograms and then export the integration results to CSV.

    You can either define the EICs directly in the Additional Chromatograms section of the method or select the extracted EIC and use the menu item Chromatogram->Use Highlighted Chromatograms->Copy Definitions to Method to add them there.

    The exported CSV will be made in the same folder as the data folder and look something like this.

    Another option is to use Quant. It can offer more flexibility in the long run, depending on your exact workflow and needs. Note that by default Quant integration and signal extraction will not be set up the same as Qual, so it would be advisable to process all your data either in Qual or Quant.

    There is a good example of setting up a batch with accurate mass data starting on page 27 in the Quant My-Way Familiarization Guide found here.

    Quant My-Way Familiarization Guide

    Here are a few tips if you want to use Quant for area reporting of MS only accurate mass data.

    Use the TOF version of Quant. This will remove the MS/MS options from the Method Editor and make setting up your signals easier. While you can setup MS only methods in the QTOF version, I always find it confusing to deal with the Precursor/Product Ion and Transition fields for MS only data. In the TOF version you will just have the MZ field to specify the EIC desired. 

    One setting that is not obvious for EIC extraction is the Mass Extraction Setup. This is under the Advanced Task on the left hand side in the method editor. The default extract width is +/- 100 ppm. You can adjust this to meet your needs.

    You do not have to set up concentrations, qualifiers, or a calibration curve. A valid Quant method only needs to have the compounds defined. Once the method is applied and the batch analyzed you will have a table of samples with only the RT and response/area.

    You can also switch to a sample based view.

    I generally do not recommend direct export of the batch table for reporting, since it is possible to export the table without fully processing or saving the batch. But in a case where concentrations are not being calculated and you are just comparing areas, it can be a useful way to get your results into an Excel file. The option to export the Batch table is available from the right click context menu of the table.

    You can also adjust and arrange the visible columns, change the formatting, and you would have access to a wider variety of report templates that would allow for further customization of your response results if needed.

    In addition to the familiarization guide, I would recommend the Quantitative Analysis Basics and Advanced webinars to get a good overview of Quant and its features. 

    MassHunter Software Webinar Series | Agilent

Reply Children
No Data
Was this helpful?