Masshunter Curve Fit Formula Different in Batch Table v Cal Curve Graph

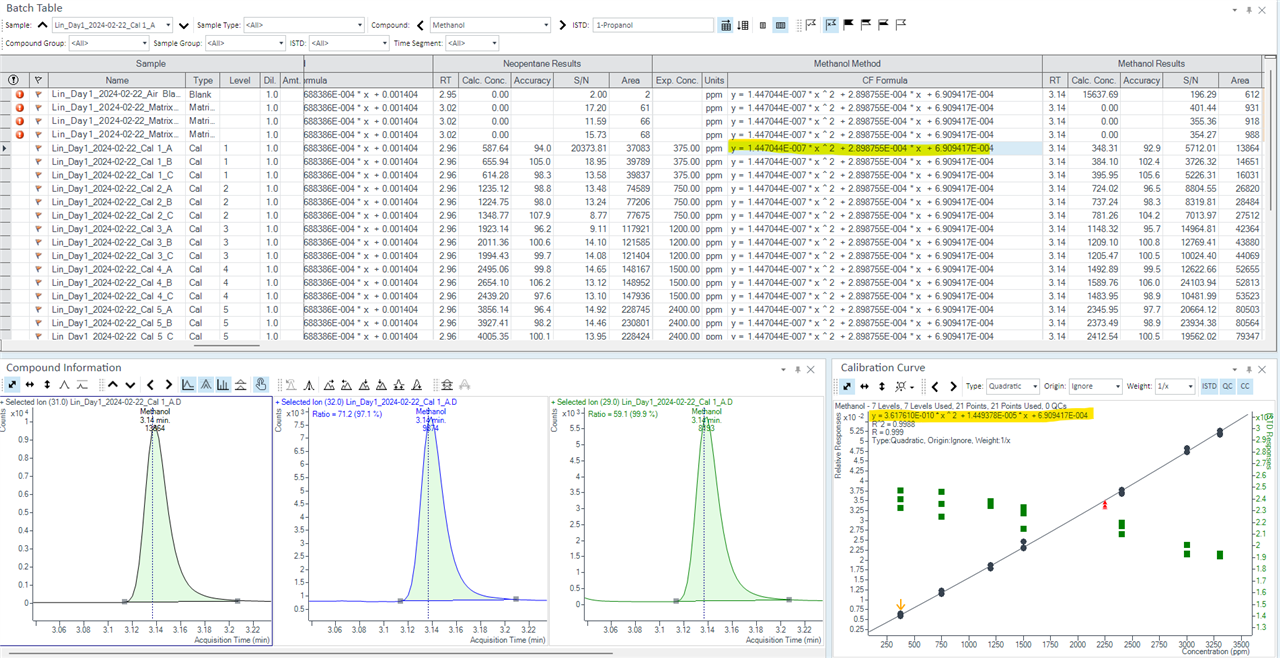
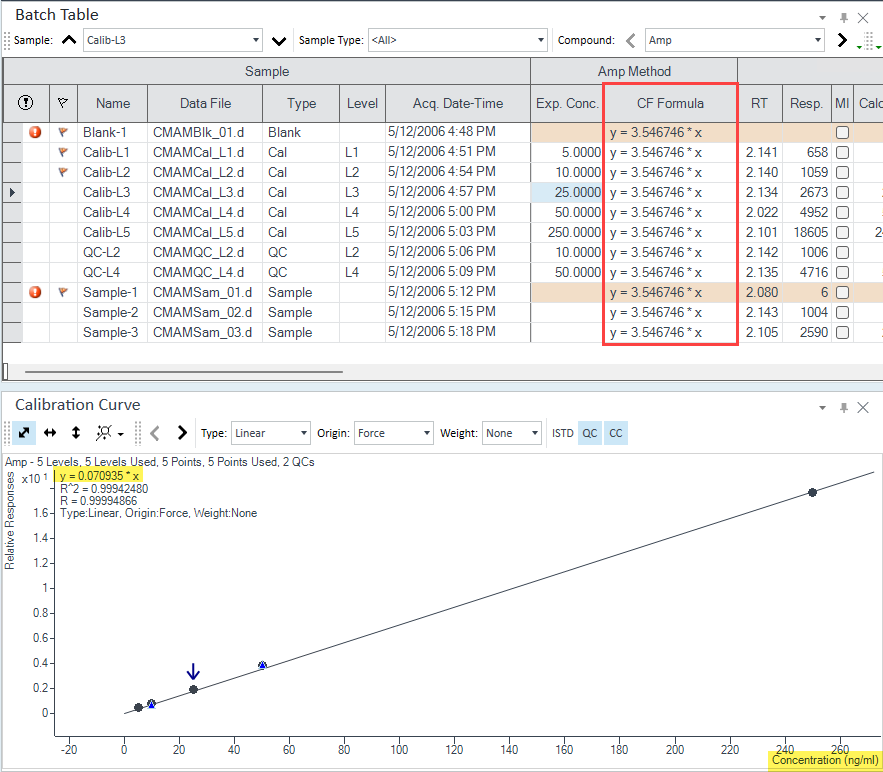
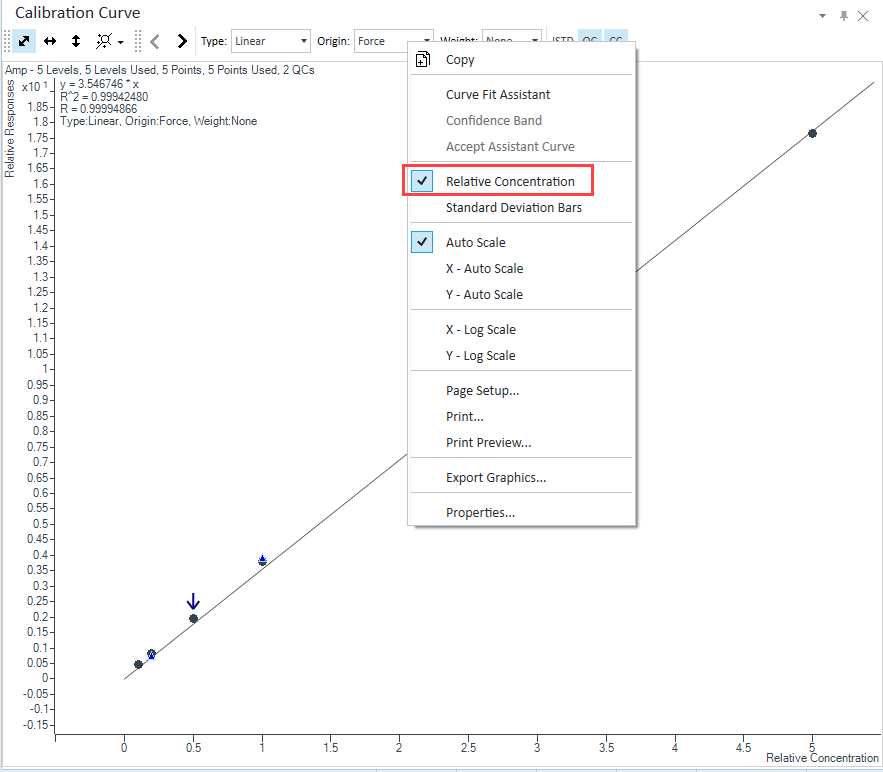
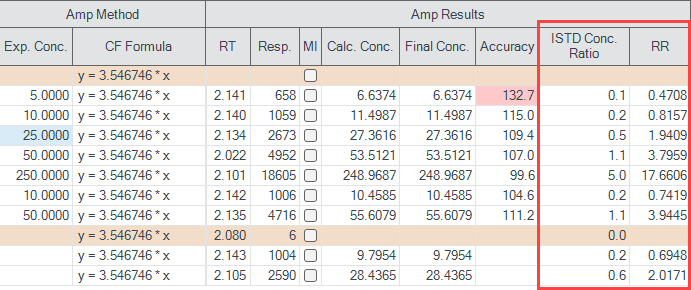
I saw this same question was asked years ago but no solution was determined. The CF formula is different between the batch table and the cal curve graph. We are using ISTDs. Supervisor says one formula (batch table) is not taking ISTD into account but the cal curve graph CF formula is. How can we get them to use the ISTD and match?

Parents
  • Hello  ,

    I believe you are referring to this discussion.

    (+) CF Formula in MH Quant. - Forum - Mass Spectrometry Software - Agilent Community

    Without seeing that customer's data it was not possible to identify the issue. But in your case from the screenshot I can see the issue. 

    For ISTD compounds the calibration curve is made by plotting the Relative Response vs the Relative Concentration or Amount Ratio. A good explanation can be found in this post.

    (+) ChemStation External and Internal Calibration Calculations - Articles - Chromatography Software Portal - Agilent Community

    By default, the Calibration Curve window in Quant will plot Relative Response vs Relative Concentration. But you have the option to change the Calibration Curve window to display the x-axis as simply Concentration, for visualization purposes. This will change the curve fit formula in the Calibration Curve window, but it will not change that Quant is using the relative concentration when determining the calibration curve. This is why the two formulas are different. This is easiest to see with a linear, forced origin, non-weighted curve.

    I am not aware of a way to display the Relative Response vs Concentration formula in the batch table. You can change the Calibration Curve window to display the Relative Concentration from the right click menu.

    If it makes it easier for data review when plotting Relative Concentration, you can add that column, labeled ISTD Conc. Ratio, and the Relative Response, RR, to the batch table.

Reply
  • Hello  ,

    I believe you are referring to this discussion.

    (+) CF Formula in MH Quant. - Forum - Mass Spectrometry Software - Agilent Community

    Without seeing that customer's data it was not possible to identify the issue. But in your case from the screenshot I can see the issue. 

    For ISTD compounds the calibration curve is made by plotting the Relative Response vs the Relative Concentration or Amount Ratio. A good explanation can be found in this post.

    (+) ChemStation External and Internal Calibration Calculations - Articles - Chromatography Software Portal - Agilent Community

    By default, the Calibration Curve window in Quant will plot Relative Response vs Relative Concentration. But you have the option to change the Calibration Curve window to display the x-axis as simply Concentration, for visualization purposes. This will change the curve fit formula in the Calibration Curve window, but it will not change that Quant is using the relative concentration when determining the calibration curve. This is why the two formulas are different. This is easiest to see with a linear, forced origin, non-weighted curve.

    I am not aware of a way to display the Relative Response vs Concentration formula in the batch table. You can change the Calibration Curve window to display the Relative Concentration from the right click menu.

    If it makes it easier for data review when plotting Relative Concentration, you can add that column, labeled ISTD Conc. Ratio, and the Relative Response, RR, to the batch table.

Children
Was this helpful?