Two separate calibration curves in MH Quant

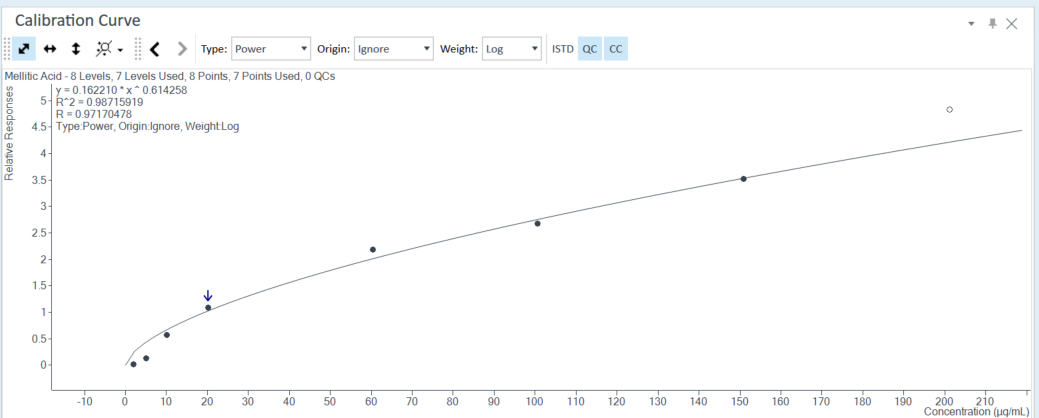
Hello! I am working with derivatized samples on GCMS, running external standard solutions (2-200 ug/mL) to build a calibration curve. Each standard and sample also has the same amount of internal standard. I would like to split my calibration curve into two sections (2-20 ug/mL and 20-200 ug/mL) to have two linear regressions for each segment. Thus far non-linear fits are working better, but standard practice from colleagues was manually splitting at the 20 ug concentration with two seperate linear regressions to account for the different response behaviours at low/high concentrations. 

Is there a way to do this? I've tried different level names but can't figure out if this is supported. Thank you!
Parents
  • Hello  ,

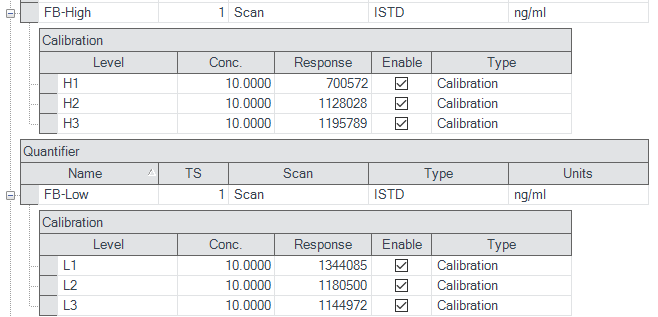
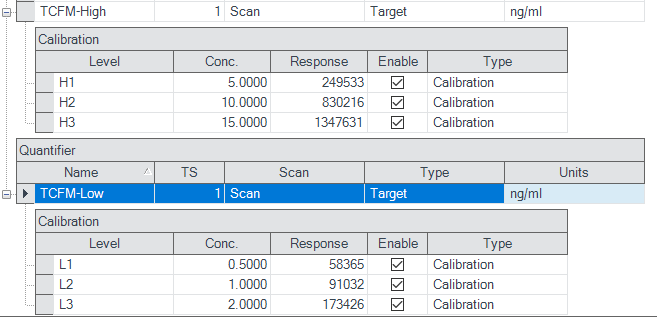
    I'm not aware of any way to do this with just one compound/cal curve. One solution would be to make duplicate compounds and assign one compound the low level standards and the other the high level standards. You can utilize different names for the standards, such as L1-L3 and H1-H3 for your low and high curves. You can duplicate the ISTD in a similar way, otherwise you will end up with a mismatch between the target and ISTD level tables. The method ISTD and conc setups would look something like this.

    Then in the batch table you would use the Calc. Conc. outlier to see which curve range would be used for a given sample. I don't have any good example data, as both of these show below the cal curve range, but this would be the general idea.

Reply
  • Hello  ,

    I'm not aware of any way to do this with just one compound/cal curve. One solution would be to make duplicate compounds and assign one compound the low level standards and the other the high level standards. You can utilize different names for the standards, such as L1-L3 and H1-H3 for your low and high curves. You can duplicate the ISTD in a similar way, otherwise you will end up with a mismatch between the target and ISTD level tables. The method ISTD and conc setups would look something like this.

    Then in the batch table you would use the Calc. Conc. outlier to see which curve range would be used for a given sample. I don't have any good example data, as both of these show below the cal curve range, but this would be the general idea.

Children
No Data
Was this helpful?