Using Mass Hunter Quant to ID compounds using a cutoff sample concentration

Good Afternoon,

I'm developing a processing method using Mass Hunter Quant. 10.2 for ethanol (quantitate) and other related volatiles (ID only). The instrument setup is a single column that splits to two detectors FID and MS (FID for quant purposes and the MS for ID). Ethanol will have a calibration curve using n-propanol. The ethanol has been relatively easy to setup.

My question pertains to the other volatile compounds that we'd like to be able to identify should they show up in a sample. We will have a cutoff sample (with these other compounds at the cutoff concentration) which is separate from the ethanol calibrators. How do I setup the processing method to call these compounds if they are above the cutoff sample concentration without using a calibration curve in Mass Hunter Quant?

Parents
  • Hello  ,

    To do this in quant you will need calibration information for your ID only compounds, but you have that information in your cutoff sample. You can use this sample to create a single point calibration for your ID only compounds. You would start by creating a unique calibration level name for this cutoff standard and use your normal level naming for ethanol. Then you would disable your cutoff standard level in the ethanol curve and disable all of the ethanol points in your cutoff targets' curves. This would allow you to quantitate your ethanol and then establish a limit of detection or reporting for your other compounds. 

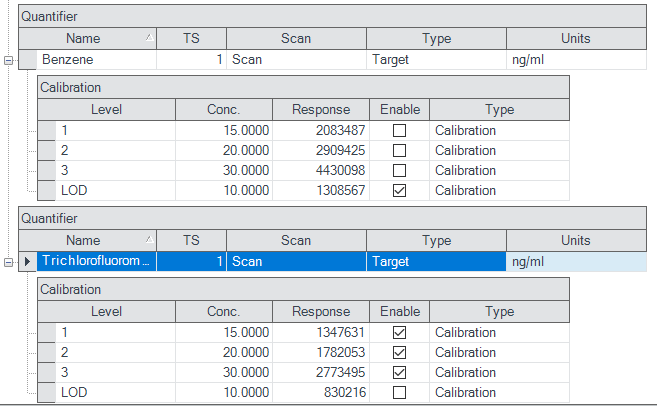
    As an example, let's say you run your cutoff standard along with your target standard. I'm using the VOA data set files for this example, so the file names don't exactly match, but I'm using CAL_L07 for the cutoff values for acetone and benzene, and CAL_L08 through CAL_L10 for my target, trichlorofluoromethane. I've named the cutoff standard level LOD and the others 1 through 3. When you create your calibration table quant will update all the levels for all of the compounds. But after this is done, you can disable the points in the curve that are not needed for a given compound. 

    Then you set up the cal curve for the cutoff compounds to be Average of Responses and leave the target compound with its usual curve type. I just left it Linear.

    Finally, if you are not already using the LOD outlier, you can set this to the amount in your cutoff standard and use the Action to Zero Peak below LOD to clear any Final Conc. below this limit.

    After analyzing the batch with this method, these are the results.

    After going to the Tools menu and choosing Actions -> Zero Peak below LOD and re-analyzing I have these results.

    This will have cal curves with unused points for all compounds. If this is not desirable then you would need to set up two separate batches, one for your quant compound and one for the cutoff reporting compounds.

    In your report you would have to decide how you want to handle these other compounds. There are a few discussions about that on the forums. Here is a recent one with some examples.

    (+) Report builder - Final Concentration Expression Change - Forum - Mass Spectrometry Software - Agilent Community

Reply
  • Hello  ,

    To do this in quant you will need calibration information for your ID only compounds, but you have that information in your cutoff sample. You can use this sample to create a single point calibration for your ID only compounds. You would start by creating a unique calibration level name for this cutoff standard and use your normal level naming for ethanol. Then you would disable your cutoff standard level in the ethanol curve and disable all of the ethanol points in your cutoff targets' curves. This would allow you to quantitate your ethanol and then establish a limit of detection or reporting for your other compounds. 

    As an example, let's say you run your cutoff standard along with your target standard. I'm using the VOA data set files for this example, so the file names don't exactly match, but I'm using CAL_L07 for the cutoff values for acetone and benzene, and CAL_L08 through CAL_L10 for my target, trichlorofluoromethane. I've named the cutoff standard level LOD and the others 1 through 3. When you create your calibration table quant will update all the levels for all of the compounds. But after this is done, you can disable the points in the curve that are not needed for a given compound. 

    Then you set up the cal curve for the cutoff compounds to be Average of Responses and leave the target compound with its usual curve type. I just left it Linear.

    Finally, if you are not already using the LOD outlier, you can set this to the amount in your cutoff standard and use the Action to Zero Peak below LOD to clear any Final Conc. below this limit.

    After analyzing the batch with this method, these are the results.

    After going to the Tools menu and choosing Actions -> Zero Peak below LOD and re-analyzing I have these results.

    This will have cal curves with unused points for all compounds. If this is not desirable then you would need to set up two separate batches, one for your quant compound and one for the cutoff reporting compounds.

    In your report you would have to decide how you want to handle these other compounds. There are a few discussions about that on the forums. Here is a recent one with some examples.

    (+) Report builder - Final Concentration Expression Change - Forum - Mass Spectrometry Software - Agilent Community

Children
Was this helpful?