Mass Hunter Report Builder Flow for graphics (10.2)

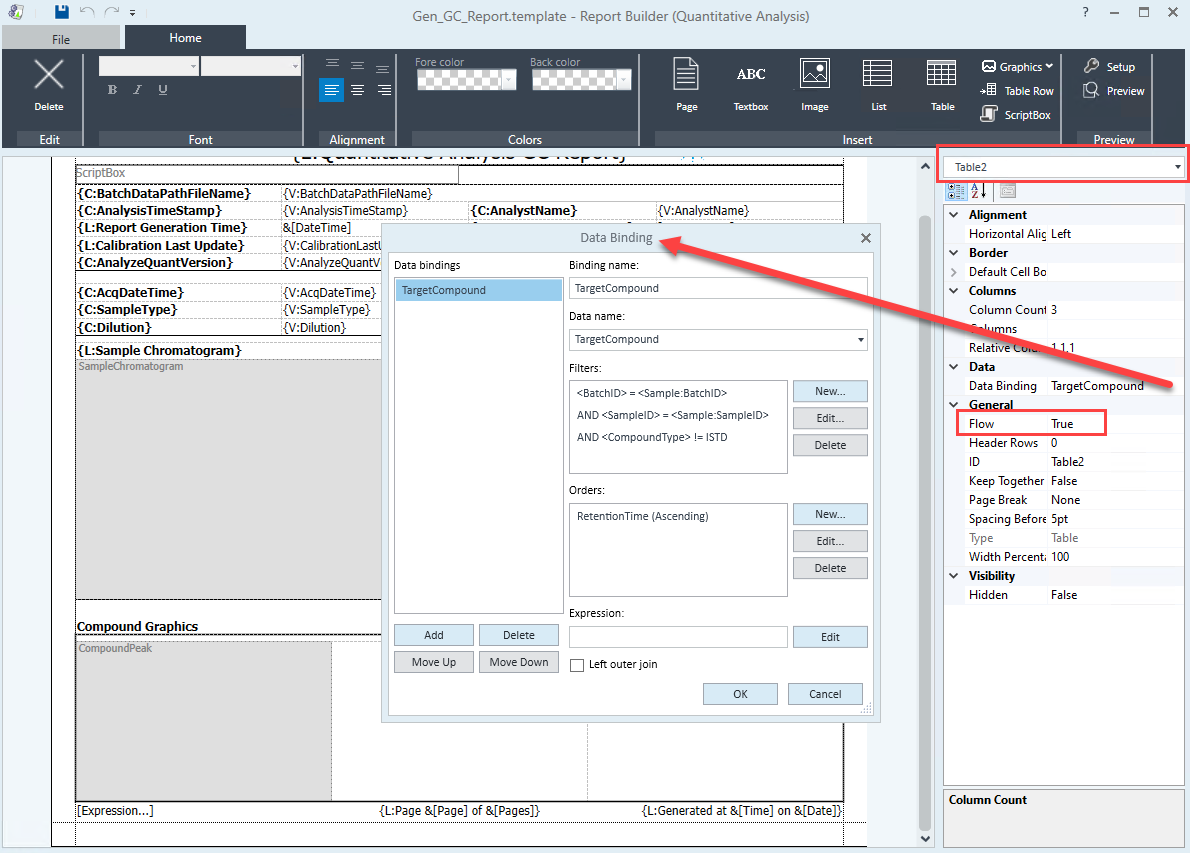
Hi, I am trying to get a report that runs the compound peaks for different compounds on the same line of the report. I've set the flow to true, removed headers and multiple cells in the table. 

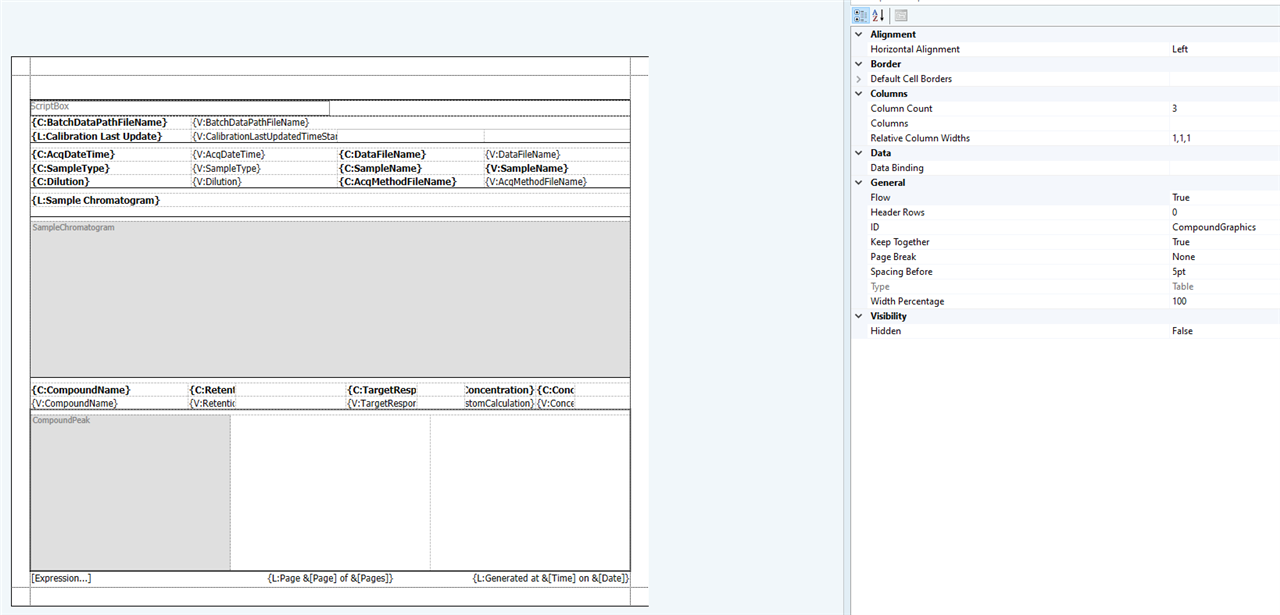
I've tried the table at 3 cells with the graphic at 100%, as well as 1 cell with the graphic at 100%, I've also tried the table at 33% of the text box. Here is my current template: F2_report20230310.template.xml

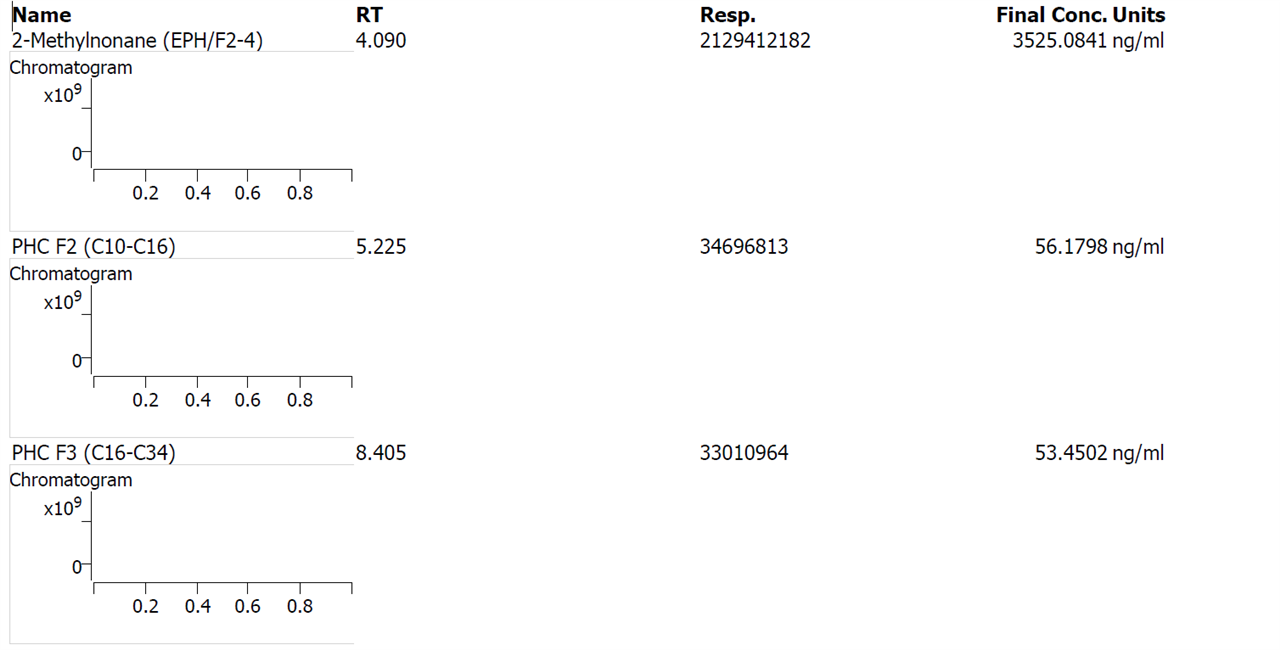
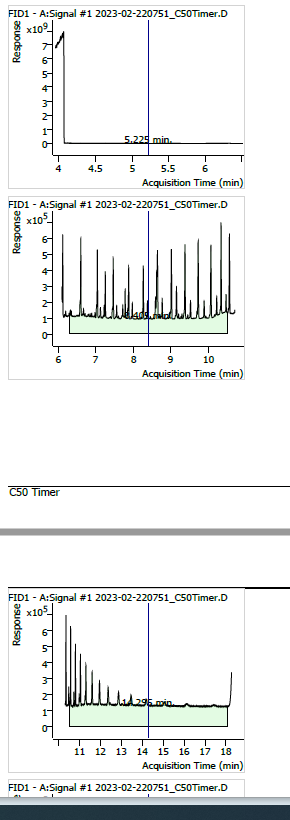
This is the setup that reports: 

Python is not an option. 

Parents
  • Hello  ,

    I apologize for the delayed response. 

    For the Flow option to work in a table the data bindings must be in the table and not in a list that contains the table. Many of the shipping templates have the graphics set up this way, and in that configuration the Flow setting will not allow the graphics to repeat.

    The best working example to start from would be the template Gen_GC_Report. Table 2 is within List 1 which gets it the sample bindings, but the TargetCompound bindings are in Table 2 and not in a list that contains Table 2. 

  • Is there an example where this works with a results table?  The the template Gen_GC_Report does not include numerical/text results. 

    So now the best I can get is: 

    There is no chrom in the chrom graphics (possibly because I have other data bindings for the text results), with the flow set to false: 

    OR worst yet, with flow on - where my text result table flows and nothing useful shows up including the chromatograms. 

    If I add data bindings to my graphics in my original report, I get an error - presumably because I can't have 2 data bindings that are the same. 

  •  ,

    The other caveat of the Flow option is that the table can only have one row, so you would not be able to use it with graphics and results.

    If you want to change one of the other templates to have the graphics after the results table then you have to select the list that currently contains the table and the list with the graphics table and insert a new table after this. This table will still be inside the main list but not the list with the graphics. Then set up the new table with the graphics as shown above. You can then delete the second list that contains the original table with graphics. 

  • Thanks Howard. I was able to get it with the original report I had by removing the bindings from the List2 with the graphic and adding it to the table within list2 instead. Thanks for your help! I did try to create a new table in the List1 with the results table, I could not get that to go - the table with the bindings either gave me an error or just didn't show up, but in the process I figured out how to do the bindings from your original response.  Thanks again!

Reply
  • Thanks Howard. I was able to get it with the original report I had by removing the bindings from the List2 with the graphic and adding it to the table within list2 instead. Thanks for your help! I did try to create a new table in the List1 with the results table, I could not get that to go - the table with the bindings either gave me an error or just didn't show up, but in the process I figured out how to do the bindings from your original response.  Thanks again!

Children
No Data
Was this helpful?