Qualifiers in Report Builder

I'm making progress on this template, but I've got some new questions!

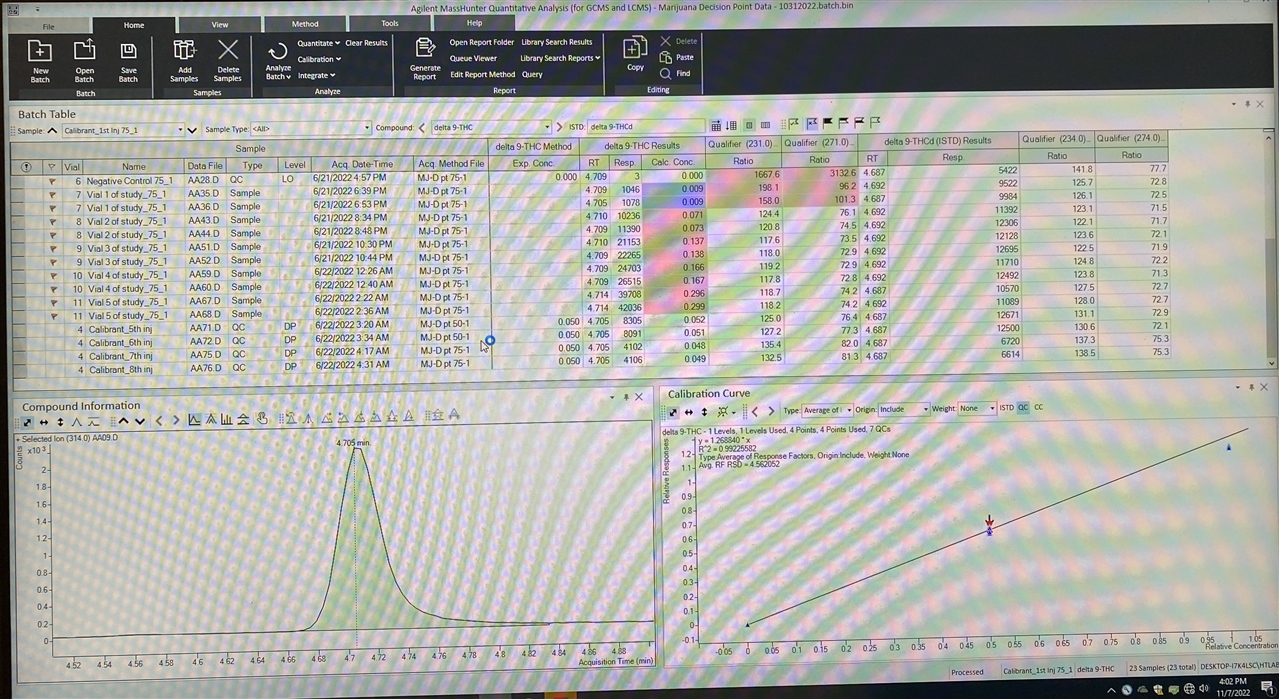
I am editing the shipping template Gen_Complete_ISTD  What I have so far for the preview is attached.  I've also included a photo of this data in MS quant (because I have questions)

My assay does have qualifiers that I need to include.  This template was a decent starting place because it includes the ratio of at least one qualifier ratio and I tried to decipher how it selected the apparent 231/314 ratio--but I have had no success.  I need to have all four of these ratios:

231/314 (already included in the sample report), 271/314 ratio, 234/317, and 274/317

I would need these in the summary at the top as well as in the Sample Report.

Also, how am I able to get it flag the ratios outside 20% like it does in MS quant (see photo)?  Ultimately, I would also like it to flag the calculated concentrations  > 0.050 mg/mL with "> 1%" and < 0.050 mg/mL with "< 1%"

(I will have to add the photo of MS quant to this post later)


Parents
  • I'm adding a photo of MS Quant showing the qualifier ratios and how they're flagged.  I did want to add these ratios to the batch summary at the top as well as the sample report.     

  • I did figure out that the <top1> in the data binding can be changed to <top2> and it will list the second qualifier ratio after the first one.  However, it duplicates all the other information.  Plus, I'd rather have that in a separate column.  

  • Hello  ,

    I wanted to post what we discussed during your call with the support center to help anyone else with similar questions.

    As you discovered, you can use the <top x> filter to retrieve the top x rows that are returned. If you do this on the qualifier results table, you will get two rows that are identical except for the qualifier information. If you want all rows, to account for compounds that may have one, two, or more qualifiers, then just remove the <Top x> filter. You could also add a column for binding TargetQualifier field MZ to display the qualifier's m/z value for a given row.

    If you'd like the two different qualifiers on the same row, then you would need to change the TargetQualifier binding's last filter to be for <QualifierID>=0. This will select the first qualifier. Then you could duplicate this binding, calling it TargetQualifier2, and make its last filter <QualifierID>=1, selecting the second qualifier. You would also need to duplicate the QualifierPeak binding and reference your duplicated TargetQualifier. Then add any columns for the second qualifier using the two new binding.

    To show the ISTD results in the summary table, remove the <CompoundType> != ISTD filter.

    To have the report cell highlighted for outliers like the batch table, you will need to utilize an expression. There are examples in several of the shipping templates. The System Suitability template probably has the best examples, showing how to color outliers for results with just a lower or upper limit, and also results that have both. To find the name of the database entries for the expression, use the Quant Dataset manual. This is installed as part of the help, but it can be easier to just copy the pdf directly from the USB installation drive. It is in the folder \Additional\Schema.

Reply Children
No Data
Was this helpful?