MS Quant Report Builder customize template to add ISTD graphics from SIM data

I am completely new to Report Builder for developing report templates, but have worked a little bit in OpenLab on templates.  I switched jobs and even the application is different, so I anticipate having to ask a bunch of questions to get this template to where I need it to be.  I've read the Familiarization Guide and I've watched as many videos and read as much as I have been able to find.  To start, this seemed like a basic thing to be able to do; so I was surprised I could not figure it out.

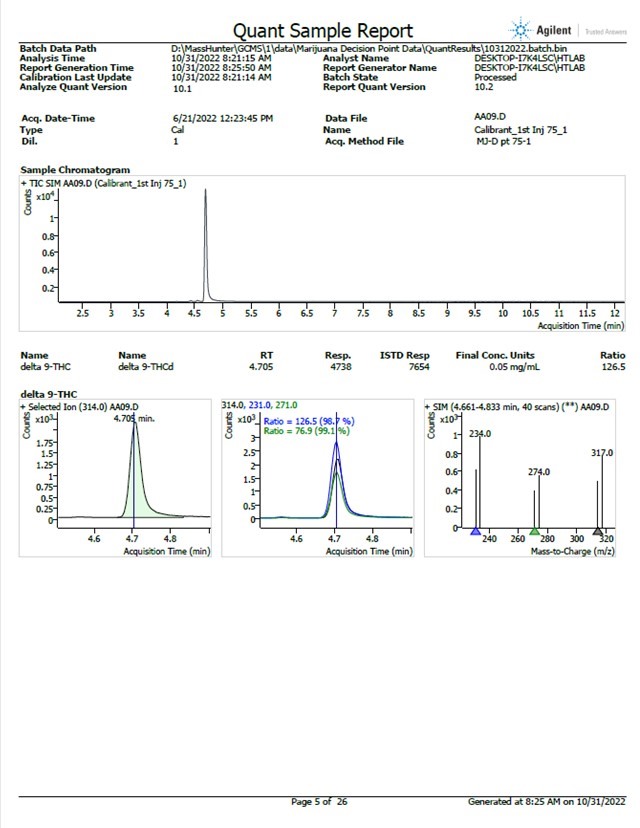
My assay is a semi-quantitative decision point for THC.  Acquisition was in SIM mode.  The shipping template I've chosen to customize is:    Gen_Complete_ISTD

This template displays quantifier ion 314 and the qualifier ions 231 and 271.  I want it to also display the ISTD quantifier ion 317 and qualifier ions 234 and 274.  See attached page.  

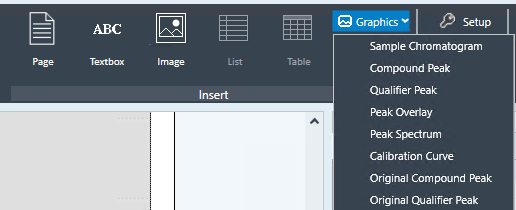
I can't figure out how nor was I able to find anywhere online how you add graphics to the template.    Thanks for any help!


Parents
  • Hello  ,

    To have the ISTD graphics displayed you need to change the filtering for the list binding. You won't need to add additional graphics. The shipping template excludes compounds flagged as ISTDs. For the template Gen_Complete_ISTD select List1 and edit the data binding to remove the filter for CompoundType != ISTD.

    For reference, if you want to add graphics, you need to find an example shipping template that has the graphics you want. Select the graphic element and note the settings in the ID section. For example, the CompoundPeak graphic uses these settings.

    Then in the template you are modifying, add that graphics type using the drop-down selection in the ribbon.

    Then in this new graphic, set the ID settings to match the example from the shipping template.

    You can open multiple copies of the Report Builder to make it easier to match the ID settings between templates.

  • Awesome, this worked great!  Now I understand a bit more about the data bindings.  What is it about the language <CompoundType> !  = ISTD that excludes the ISTD--is it the "!"

    Just out of curiosity, is there a way to re-order the display of these graphics?  I was expecting it to list THC first and then THC-ISTD (since this was how I listed them).  Instead, it put the ISTD first in the graphics.    

  •  ,

    The not equal to operator is '!='. In this binding it selects all sample types that are not equal to sample type 'ISTD'.

    By default, results are ordered by ascending retention times. You can change this in the Orders section in the binding right underneath the Filters section. 

Reply Children
No Data
Was this helpful?