Attributes on Mass Profiler Professional

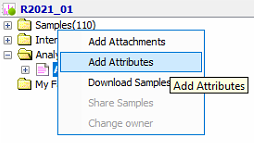
Hello! I am working in Mass Profiler Professional software (MPP), can someone explain to me what are the attributes that can be added to the samples, please?

Parents
  • Hello

    i use masshunter profiler . 

    This software is primarily designed to compare untargeted analysis , when there is no target compound

    such as environmental samples ( soil and water samples) , or metabolism samples. 

    software can also identify the unknowns and compare them

    it's very good choice for researchers and universities , it's not designed for QC work

    for example this for a comparison of two samples , profiler identified the peaks and compared them 

  • HI! That is what I am using it for, but I don't know what are the attributes or what do they refer to. Are those the same as grouping?

  • Profiler detects every possible compound according to algorithm called Q score 

    so Q score means probability of spectrum to be a compound , less Q score means the spectrum may be a noice

    you can se you Q score criteria , also your abundance criteria

    this is the first thing .

    then in the table he will group the compounds according to Rt , area , and Q score , so you can compare the 2 groups

    if compound is detected in on group but not in the other you will find one result for it only while the other sample results will be empty and log A1/A2 is high ( 16 which is very high ) like in the lower picture

    but notice that most of them are usually noice so you need to neglect them or to increase your abundance and Q score criteria

    ...

    after grouping you can mark some of them and compare them graphically 

    also you can identify the compound using Nist library if it is GC MS or other useful library if you are using LC QTOF

Reply
  • Profiler detects every possible compound according to algorithm called Q score 

    so Q score means probability of spectrum to be a compound , less Q score means the spectrum may be a noice

    you can se you Q score criteria , also your abundance criteria

    this is the first thing .

    then in the table he will group the compounds according to Rt , area , and Q score , so you can compare the 2 groups

    if compound is detected in on group but not in the other you will find one result for it only while the other sample results will be empty and log A1/A2 is high ( 16 which is very high ) like in the lower picture

    but notice that most of them are usually noice so you need to neglect them or to increase your abundance and Q score criteria

    ...

    after grouping you can mark some of them and compare them graphically 

    also you can identify the compound using Nist library if it is GC MS or other useful library if you are using LC QTOF

Children
Was this helpful?