MassHunter S/N

Hello,


On company that I work, in Portugal we have a GC-MS with MassHunter software.


Since the implementation of the software for the GC-MS we are manually using the formula below for the calculation of the EP signal to noise:


S/N = 2 * ( Noise of Raw Signal LOQ / Noise of Raw Signal Blank)


For the Noise of raw signal we use values given by the software and it is used the same region of noise both for blank and standard/sample injection.
When we compare this approach with other software’s it is not clear some points and we could not find the answers in the Agilent manual.


Can you please give us support on the questions below?


1. By default the software uses a noise SD multiplier with a value equal to 5. (It is possible to change at least between 1 and 5). This factor does a direct multiplication to the NRS value calculated. Why the default value is 5? What means?


2. What is the difference between the peak height and the NRS?


We are considering about changing the approach from NRS to use Peak height instead, however, we still need to know which value of noise SD multiplier we should use because it will make a big difference on blank noise, and doing that, we are considering to use this formula:


S/N = ( 2 * Peak Height ) / Noise of Raw Signal Blank


It seems logical to you, doing this "change" and update the way that we calculate S/N?

  • Hello ,


    The value of 5 for the noise SD multiplier is a quant program default value and is not meant to be a recommendation of what value should be used for this parameter. As with any method parameter, the value used for noise SD multiplier should be determined and set following the procedures and policies outlined by your lab and any regulatory agencies who establish guidelines or procedures that your lab to follows. 


    Regarding peak height verses noise, in general peak height refers to the reported height of an integrated signal peak and noise is a measurement of the amount of variation in the signal for the baseline. Again which you would use and how you would calculate the signal-to-noise you report would be up to your lab policies and procedures. 

  • Hello ,


    Thank you for your answer but I still have some questions and maybe you can help me.

    Can you tell me how the software calculates noise of raw signal and peak height? Maybe with some pictures this could be easier to explain because it will be visual and easy to understand.


    This would be helpful to support the way we calculate S/N at our company.

  • ,

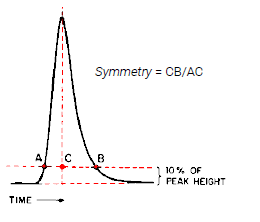
    The peak or signal height is calculated from the apex of the signal to the integrated baseline. Here is a general picture of what this looks like.


    This is from an illustration regarding peak symmetry, but the vertical line going through point C represents where the full peak height is measured.


    The noise calculations are described in detail in the Quantitation Data Set manual that shipped with your Quantitative Analysis installation media. From that document, I have made this slight reformatting and rearrangement to help make things a little more clear. The two illustrations that I'm adding are from an old ChemStation document, but since these noise determinations are not unique to MassHunter (or Agilent, as far as I know) I think they will still be useful to help in understanding some of the terms. Note that RMS (Root Mean Square) is a calculation performed on the measured noise, so there is not a good way to represent that visually, or at least none that I could find. There are many online resources that you can search for that may help explain the root mean square calculation in general.


    NoiseAlgorithmType represents the choice of algorithm to use for calculating the SignalToNoiseRatio of a chromatogram peak. The following choices of NoiseAlgorithmType are available:


    • Peak-to-Peak
    • Peak-to-Peak from Drift
    • ASTM (default)
    • RMS (Root Mean Square)
    • Auto RMS


    The noise calculation divides the chromatographic range into N “noise regions” that cover the entire range, excluding the peaks.


    Example:

    If the chromatogram covers the retention time range of 0 to 3 minutes and there are two peaks, one extending from 1.3 to 1.7 minutes, the other extending from 2.2 minutes to 2.5 minutes, then there will be N = 3 noise regions:


    [0.0, 1.3], [1.7, 2.2], [2.5, 3.0]


    Noise regions less than 3 points wide are eliminated. For the Peak-to-Peak and ASTM algorithms, the low and high abundance values are computed from the chromatogram over each noise region.


    For the Peak-to-Peak algorithm, the noise is computed as the maximum high-low difference over all noise regions:


    Noise (Peak-to-Peak) = Max ( High n – Low n ) over n = 1..N.


    The Peak-to-Peak from Drift algorithm uses linear regression to fit a drift line to each noise region and finds the difference of the maximum positive and maximum negative displacements from the regression line. The noise is then computed as the maximum displacement difference over all noise regions.


    This is a simple visual example of the Peak-to-Peak from Drift.


    For the ASTM algorithm, the noise is computed as the average of the ( High n – Low n ) differences for each noise region:


    Noise (ASTM) = Average( High n – Low n ) over n = 1..N.


    This is a visual example of ASTM noise determination


    For RMS (root mean square) noise algorithm, the system computes the root mean square variation of abundance over each noise region and takes the maximum of the RMS values over all regions.


    For Auto RMS, this algorithm works by moving a Noise region window across a defined noise region boundary and selecting the minimum noise value calculated from the Noise region window. In order to calculate the signal-to-noise ratio, the chromatogram must be integrated first. A noise region boundary is defined with a Start time and End time in minutes. A Noise region window is moved across this noise region boundary one step at a time. At each step, at least three points must be inside the window in order to calculate the root-mean-square noise value. The smallest noise value computed is used. If the smallest noise value is 0, then the noise value is set to 1/sqrt(bins). Bins is the number of points in the first Noise region window.


Was this helpful?