Evaluation of the Etune using an Xtr source

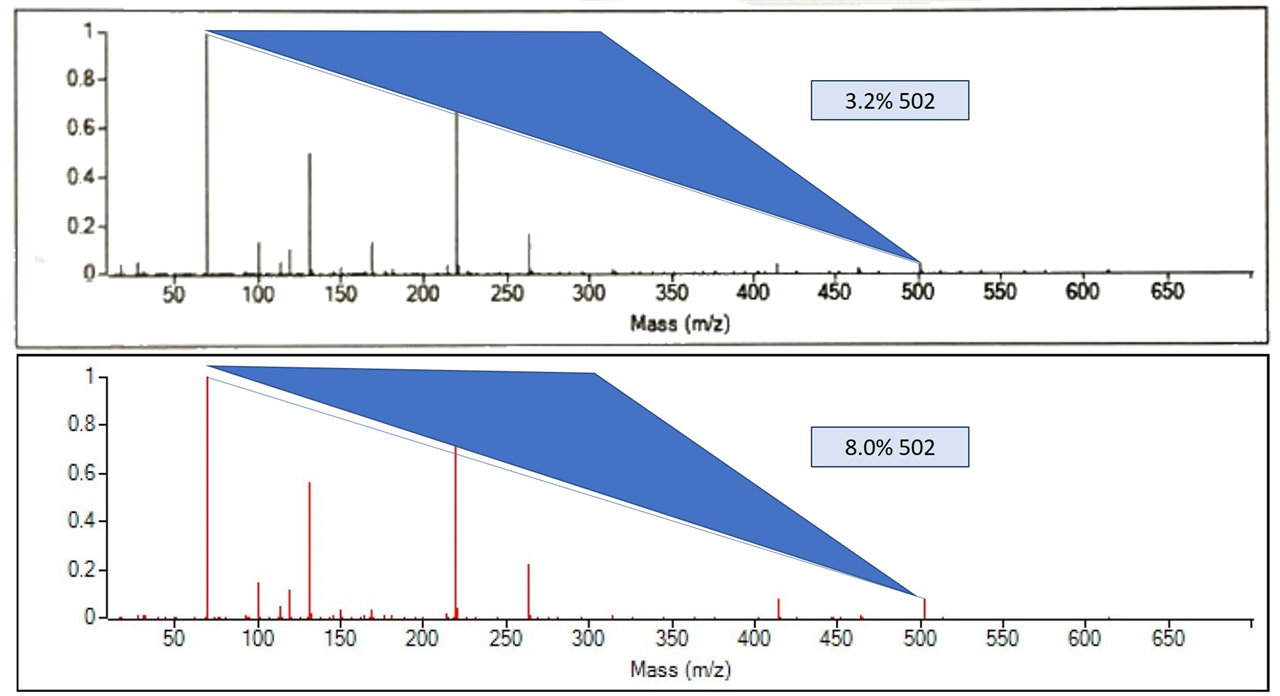
Question for those using a GCMS with an extractor source (Xtr EI 350, 5977B).  Our relative abundance for 502 ion has always been lower using the Etune compared to the Atune.  We have been using the Tune Evaluation as a criteria check for our instrument to pass and this number sometimes falls below the 2.4%.  I recently learned that the Tune Evaluation only applies to the Atune.  I also see that the 502 rel abund is somewhat arbitrary because when the 69/219 abundances vary the 502 relative changes a lot, even though the absolute abundance does not, which makes sense.  But I’m wondering what guidelines other labs use to say the instrument passes and is operating properly, since we are in the legal field we need a checkoff like a tune evaluation.   Is the 502 always lower with extractor sources using Etune?  Is there any parameter to change to boost this up?  Agilent, do you have any documentation or recommendation for us to use as passing specs for Etune or something written to say rel abun of 502 is not an important gauge of instrument condition?

Parents
  • GCMS applications need enough overall system sensitivity and a stable instrument.  EI GCMS fragments most compounds to lower than 502, most are below 360.5, half way between 219 and 502.  I think that the focus on 502 relative abundance is mostly marketing and directed at the very few who think they need it.   The difference in overall spectral tilt between a system with low and high 502 is not that much.  The actual spectral tilt only matters if the application requires higher library match quality numbers against commercial libraries.  A system with stable spectral tilt, mostly stable 219/502 relative percentages, should be the goal, not necessarily just high 502.


    The top spectrum is a SS source that tuned at 3.2% 502.  The bottom spectrum is an extractor source that tuned at 8.0% 502.  The triangles are the same. I copied/pasted the one from the top spectrum onto the bottom spectrum.  The difference in total spectral tilt from 69 to 502 is shown by the tiny space above the top of the 69 peak on the bottom one. Wow, 3.2% to 8% sounds like such a gigantic problem!  8% is TWO POINT FIVE TIMES bigger than 3.2%.  But the 219 on these two is different as well, SS to Extractor,  70% and 88.3%.  The difference between 70% and 88.3% is not that much, it's only 26% higher ...but 3.2% and 8%?  Why, that is 250% higher !   Is this just a perception problem?   

    For your application, will a higher relative abundance of 502 change your results significantly if the overall system sensitivity is normal?

    It's very easy to focus on one number, the relative percentage of 502 in the tune report, as the gauge for a GCMS but that one number does not explain the performance of the entire system.

    The other piece of this puzzle that needs to be discussed is tuning. Tuning is NOT like working really hard to get the system exactly perfectly on the only-seen-by-electron-microscope tip of a needle and can fall off instantly all the way down into the crevasse of poor system response.  Tuning is making sure that the system is somewhere in large range of acceptable functionality.  If a system passes tune – in nearly all cases, it’s working more than sufficiently fine for nearly all applications.  The act of tuning, a headspace analysis of PFTBA molecules bouncing around the inside of the entire analyzer, dirties the source the same as samples do.  The effects can be seen after thirty or forty tunes on a single quad system and faster on a tandem quad because the tunes are longer. Tuning every day or worse, a few times a day because the operator is worried, further contaminates the source.  The tuning algorithm also tunes and adjusts all parameters. Every tune changes the overall MS response.

    So, don’t autotune and don't focus on the relative percentage of 502. Run a standard injection of a peak that is very stable, easy to get, simple to use, and available every day in the right concentration.  If the peak is at the right retention time, is the right size within a reasonable range, say plus or minus 15% to 20%, and the spectrum looks typical --- RUN.   Don’t tune unless something looks bad, and then start with a quick tune first as that algorithm adjusts less parameters. 

  • Thank you Paul!  Seeing the plots of the actual spectral tilt of two different 502% puts things into visual perspective.  I am going to look at the 219/502 ratio over the history of this instrument, looks like a good parameter to go by.  Having this explanation should help us write up different passing criteria for our new instrument.  I really appreciate your time and enjoyed your 1hr video on source cleaning that I watched yesterday!  I picked up some good tips and am using the video/clips to write up a procedure for our lab.

Reply
  • Thank you Paul!  Seeing the plots of the actual spectral tilt of two different 502% puts things into visual perspective.  I am going to look at the 219/502 ratio over the history of this instrument, looks like a good parameter to go by.  Having this explanation should help us write up different passing criteria for our new instrument.  I really appreciate your time and enjoyed your 1hr video on source cleaning that I watched yesterday!  I picked up some good tips and am using the video/clips to write up a procedure for our lab.

Children
Was this helpful?