


What would cause this kind of curving on the chromatogram?
The samples below are from olefin oligomerization experiments done with different reaction temperatures, so they have different compound compositions and aromatic contents. But shouldn't these images be mostly the same shape when the same method was used and the samples don't differ that much from each other? The curved sample was run again to see if the curving repeats, and there was no difference.
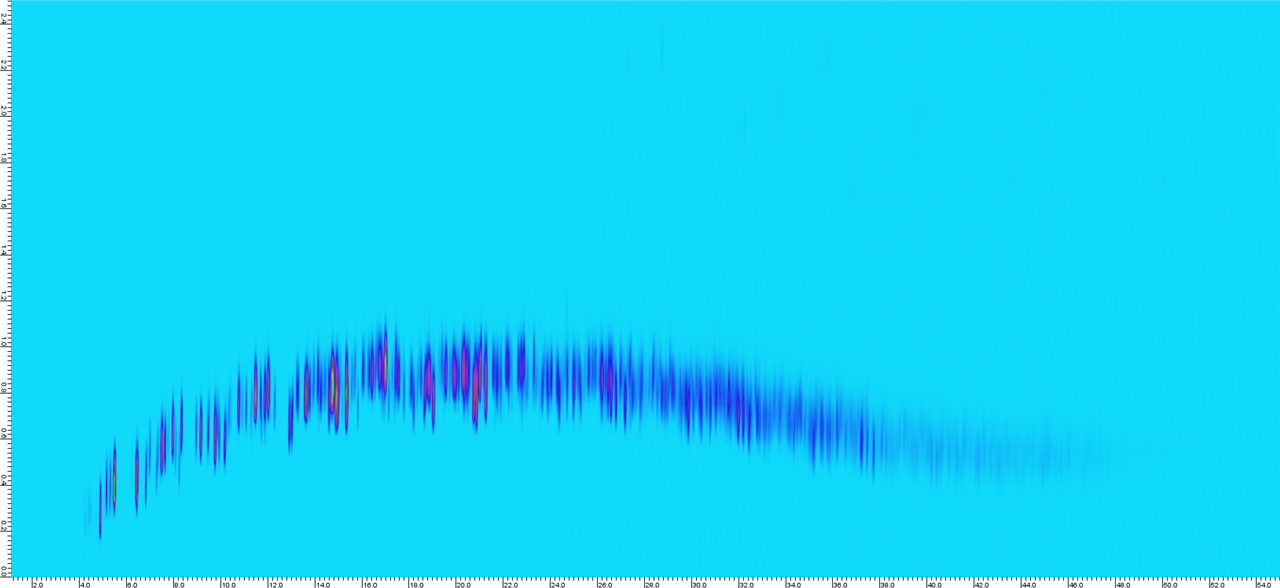
Sample 1.
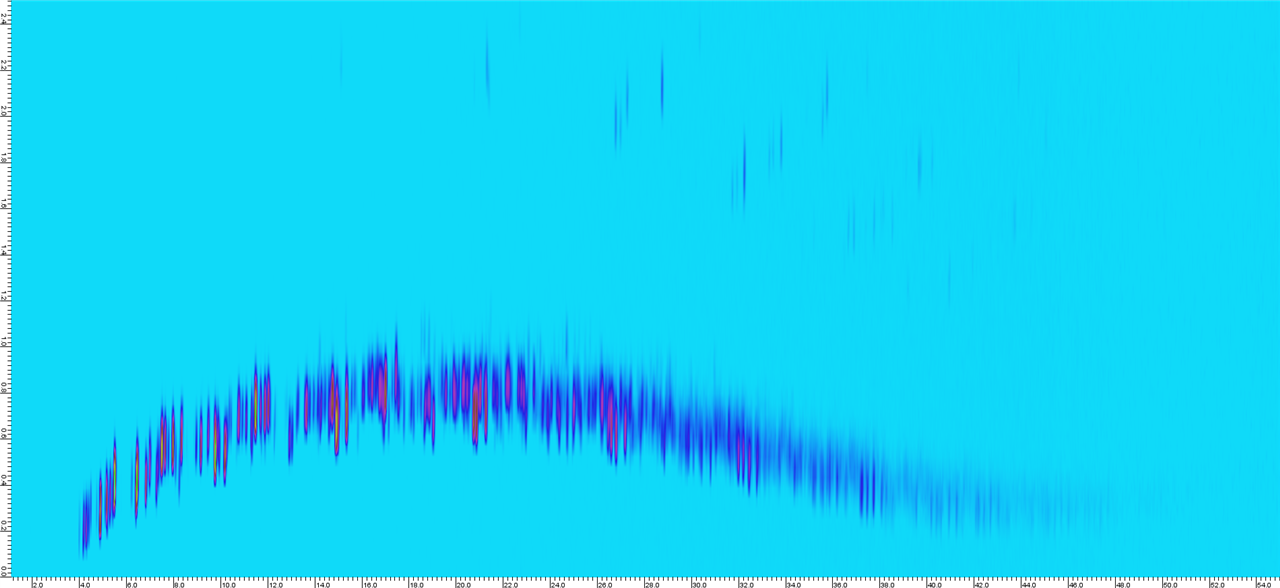
Sample 2.
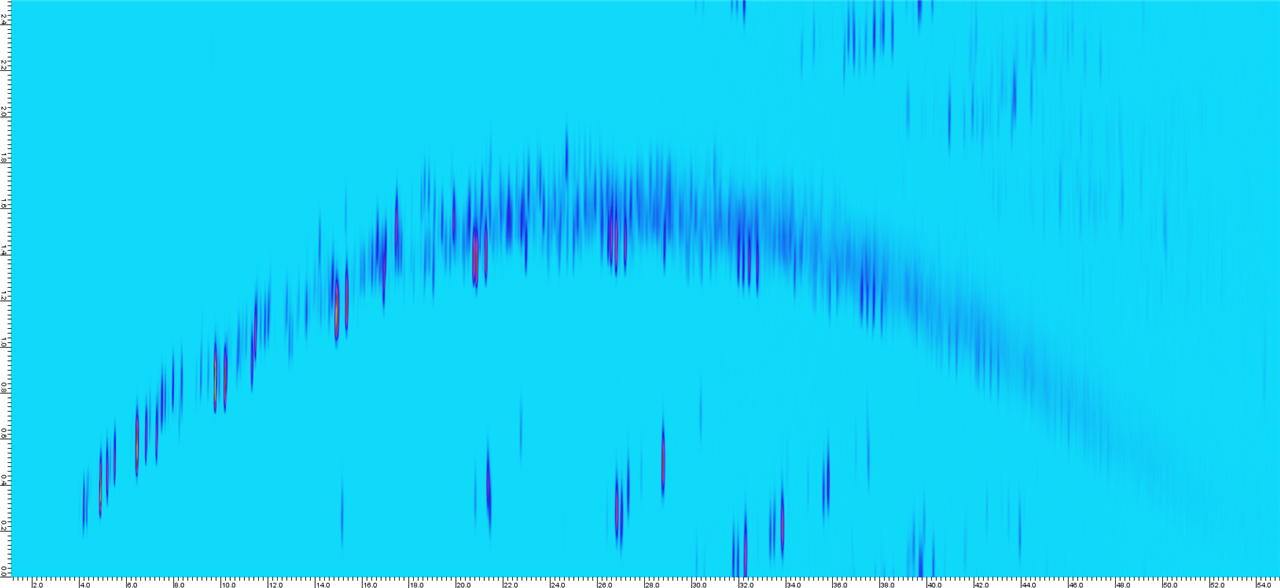
Sample 3. Suddenly there is a lot of curving and wrap around.
The method that was used in all three samples is presented in the table below:
| GC conditions | |
| Column set | First dimension: DB-5MS Ultra Inert (20m, 0.18mm, 0.36µm) Second dimension: DB-HeavyWAX (4m, 0.18mm, 0.18µm) |
| Carrier | Helium, constant flow First column: 0.5 mL/min Second column: 7.5 mL/min |
| Inlet | 0.1 µL, 250C, split mode, split ratio 1:250 |
| Oven | 40C (5), 3C/min, 280C (5) |
| MS Transfer line | 280C |
| Modulator conditions | |
| Modulation period | 2.50s |
| Inject time | 0.25s |
| MSD conditions | |
| Acquisition type | Scan |
| Mass range | 35-500 m/z |
| Scan speed | 20,000 u/s |
The GC used in these analyses is Agilent 8890 with Agilent 5977B MSD. The modulator is Agilent G3673A Reverse Fill/Flush CFT Differential Flow Modulator.
