


I'm trying to develop a method for ethanol via headspace. I am using Restek standard Residual Solvents #1 (34105) for the curve. My instrument is Agilent 6890 GC-FID with CTC PAL COMBI autosampler for headspace.
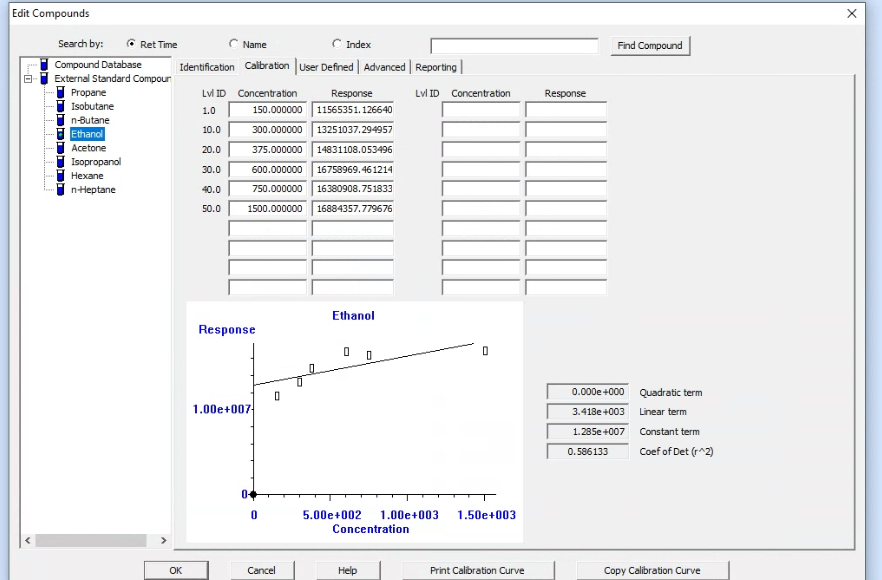
I ran residual solvent curve at high concentration (1st picture attached), there was no linearity. I then ran a curve using liquid injection, the curve was almost perfect. If you look at that 1st picture of the curve, it seems as though there’s saturation at higher concentrations.
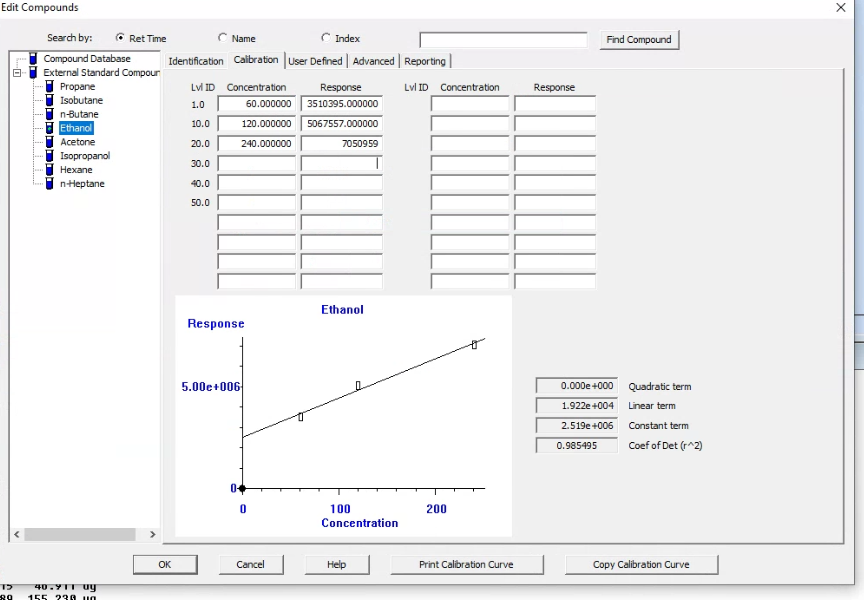
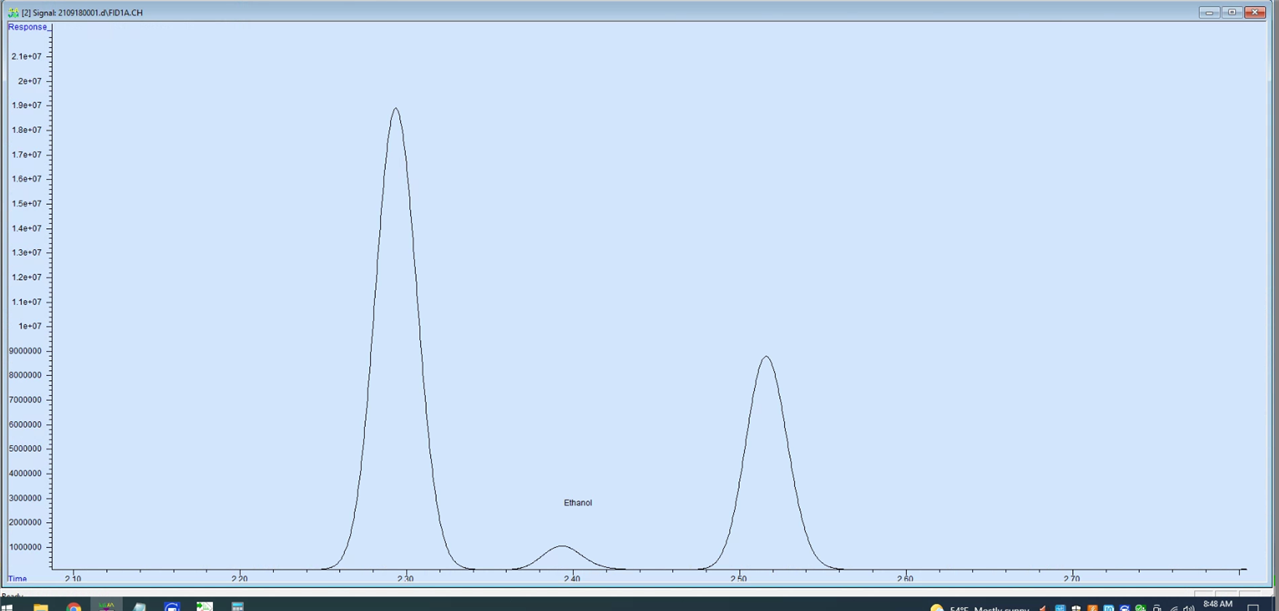
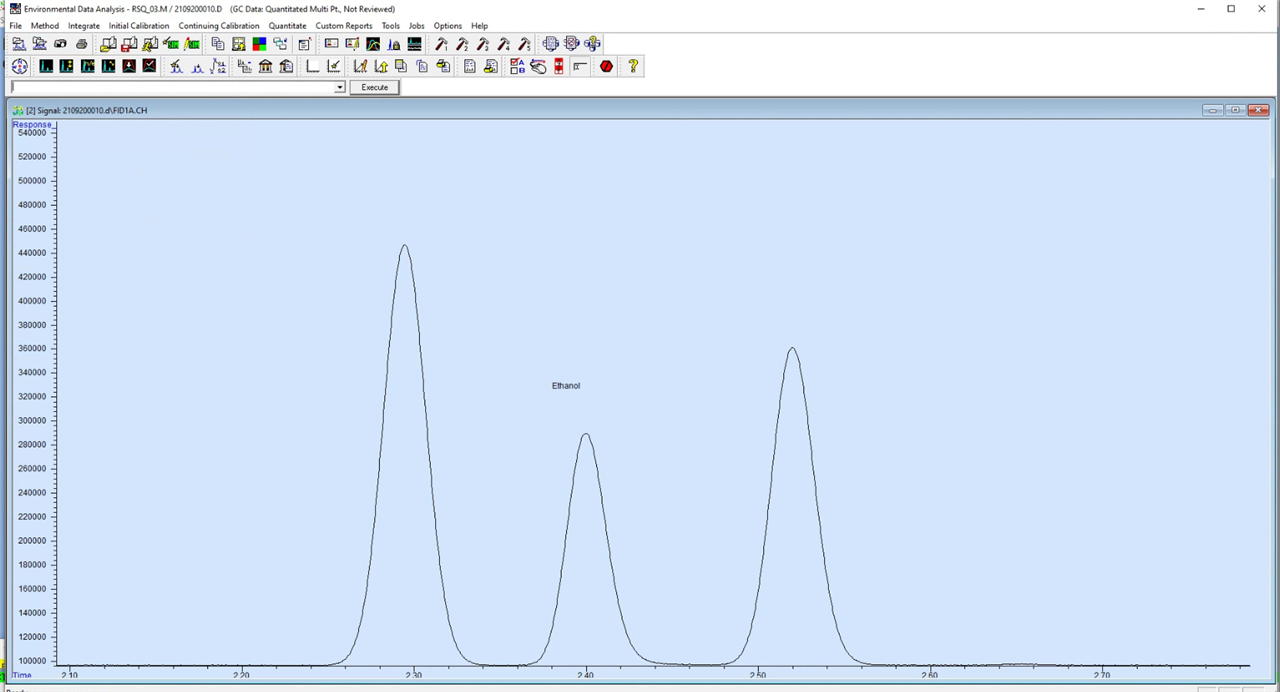
I then ran a 3-point curve with lower concentrations (2nd picture attached). Way better linearity, but still not great. I’m also noticing that at higher concentrations, the ethanol peak is way smaller than it’s surrounding compounds (3rd picture). At lower concentrations, the ethanol peak is higher in comparison to the surrounding compounds (4th picture).
I don’t believe this is detector saturation, but something else is going on because: The peak shape is showing no signs of saturation (peak fronting or flat tops). Also, running at a higher split ratio does not seem to help. So my question is, why is this happening?
Here are my current run conditions:
Inlet:
Temp: 150
Split: 50:1
Column:
Constant flow at 2.0 ml/min
Hydrogen gas
Oven:
33, hold for 6
15 80 0
55 250 1
Detector: 320
Headspace (CTC PAL):
Incubation temp: 80
Incubation Time: 1800
Syringe Temp: 110
Injection Speed: 500
