Hello
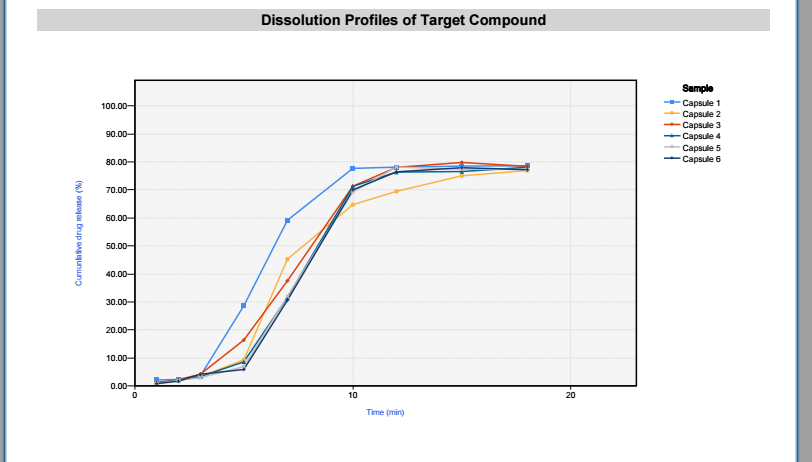
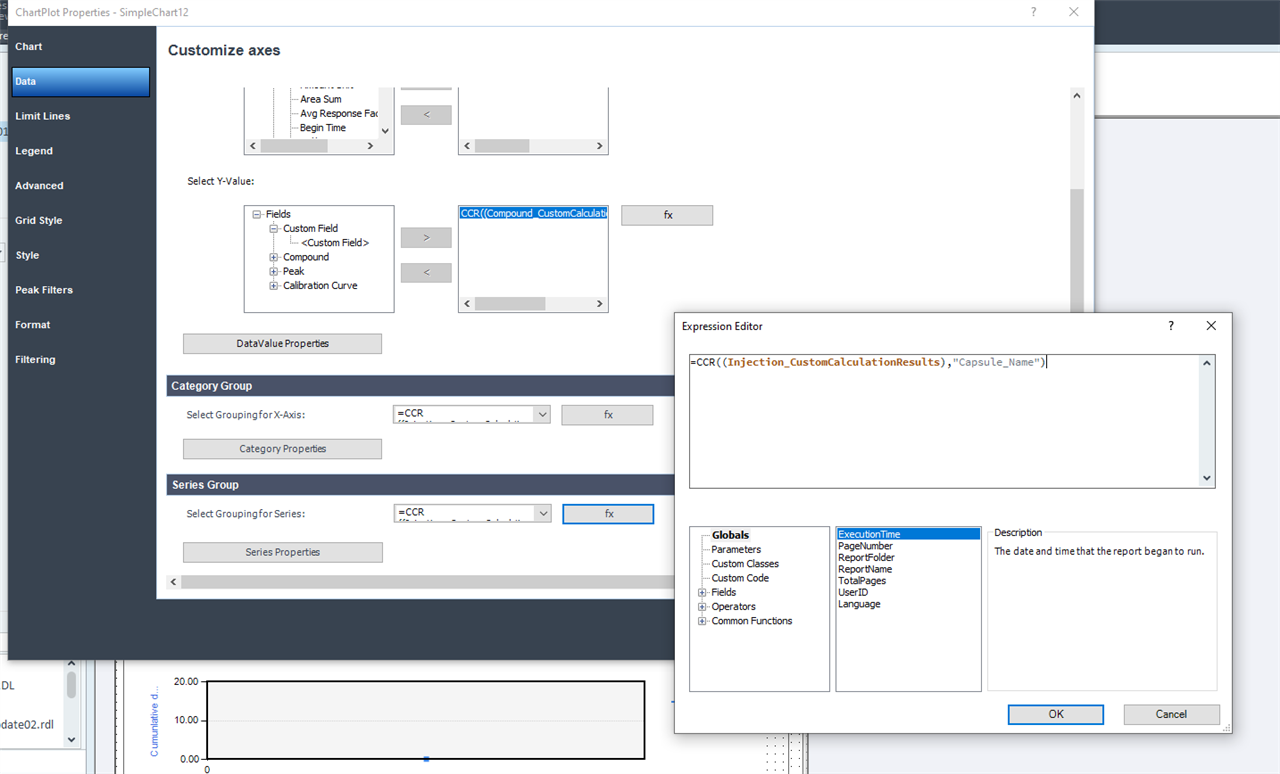
In the custom report i want to create a graph where the x axis is time ( 5,15,30,45 min) and the y axis is the average of % dissolution of 12 sample.
I have added a custom column in the report where i calculate the % dissolution and save the average as a variable.
I am using openlab cds v 2.6
Any help would be appreciated thank you.