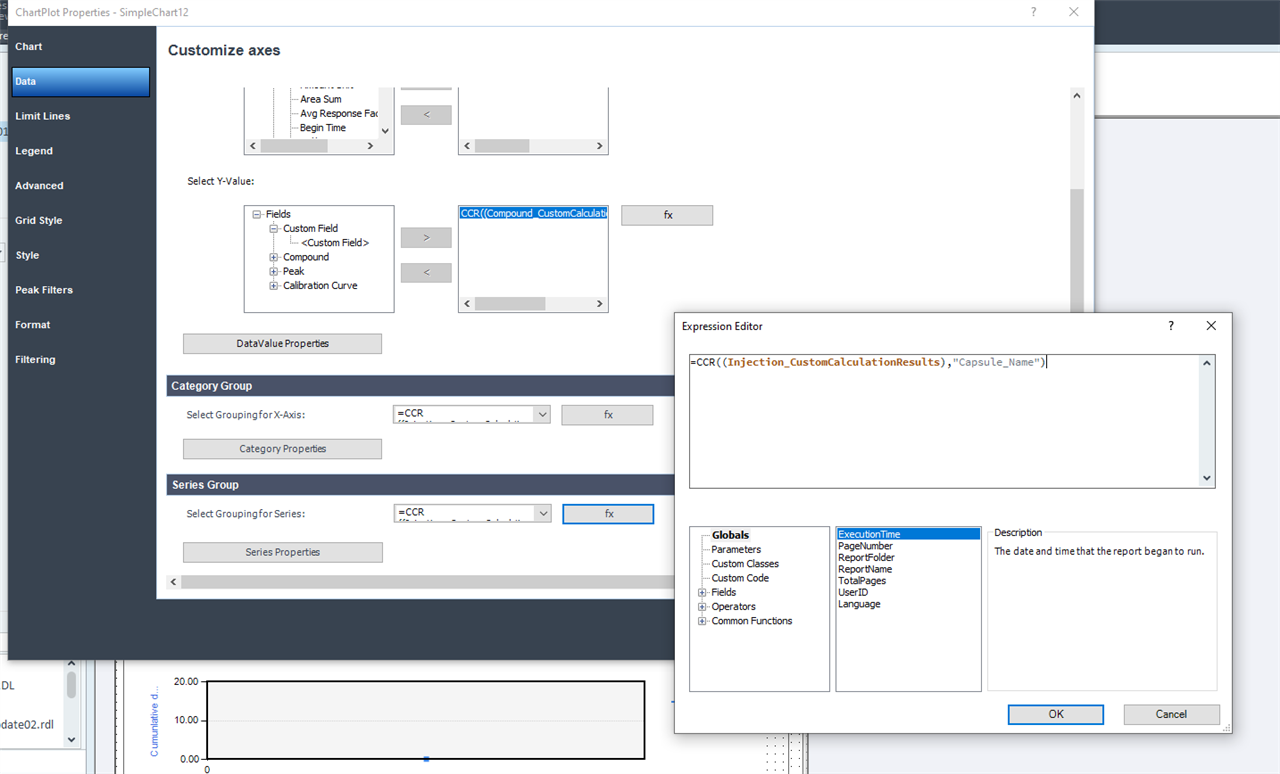
Custom graph

Hello

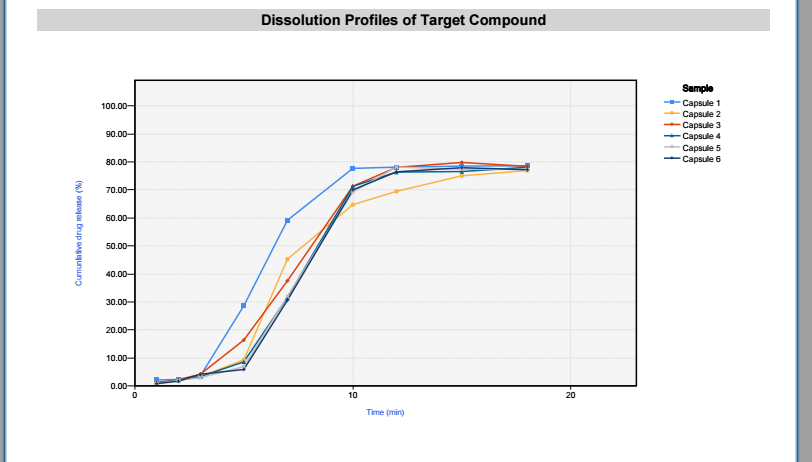
In the custom report i want to create a graph where the x axis is time ( 5,15,30,45 min) and the y axis is the average of % dissolution of 12 sample.

I have added a custom column in the report where i calculate the % dissolution and save the average as a variable.

I am using openlab cds v 2.6 

Any help would be appreciated thank you.

Parents Reply
  • Hello,

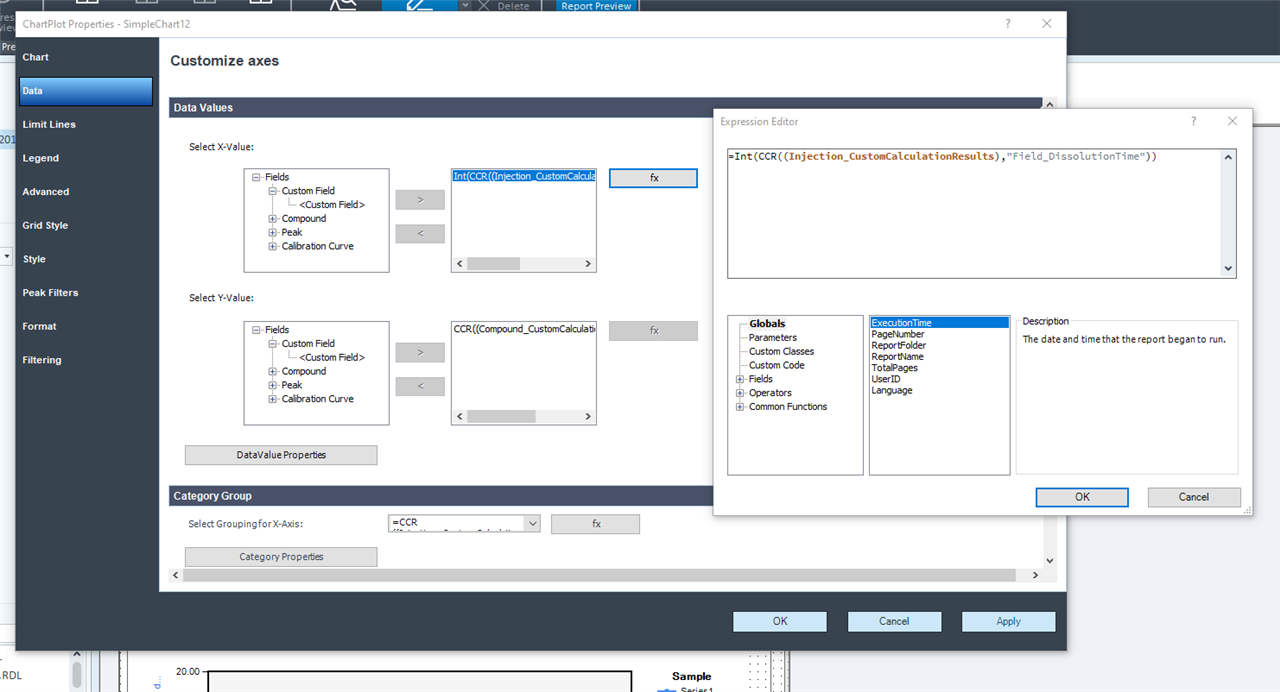
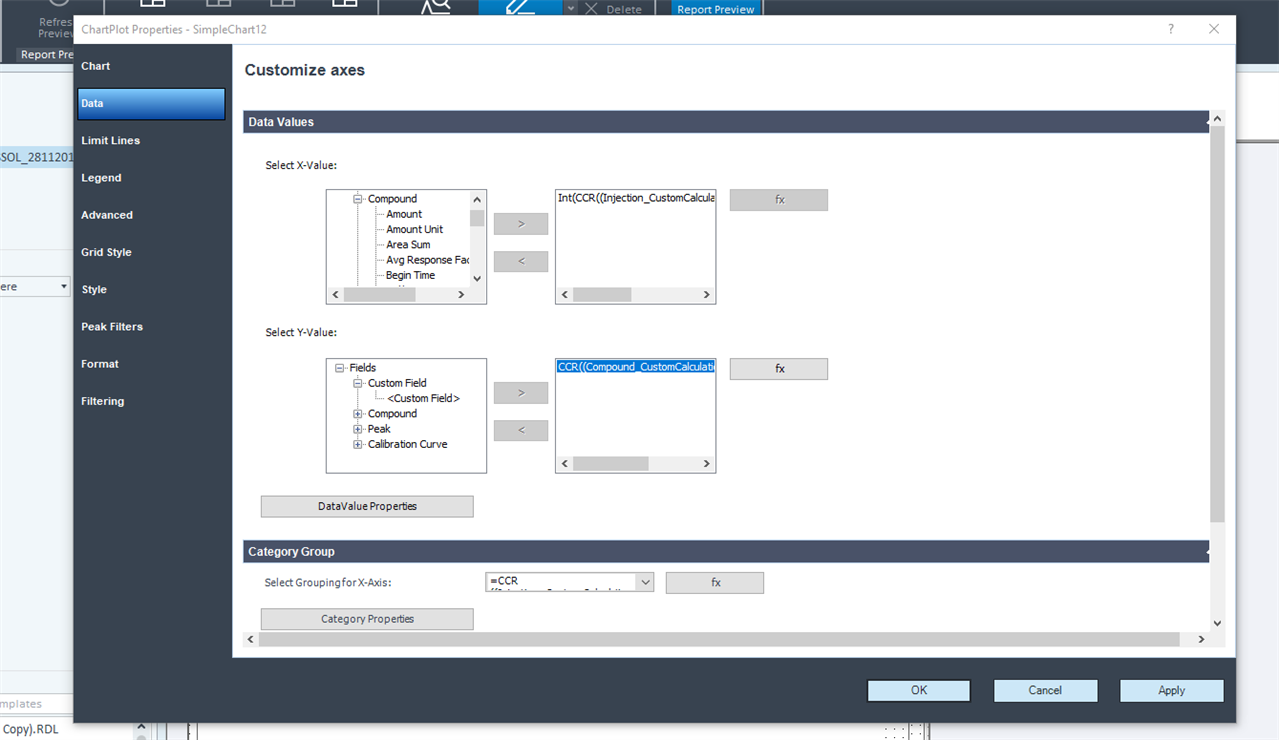
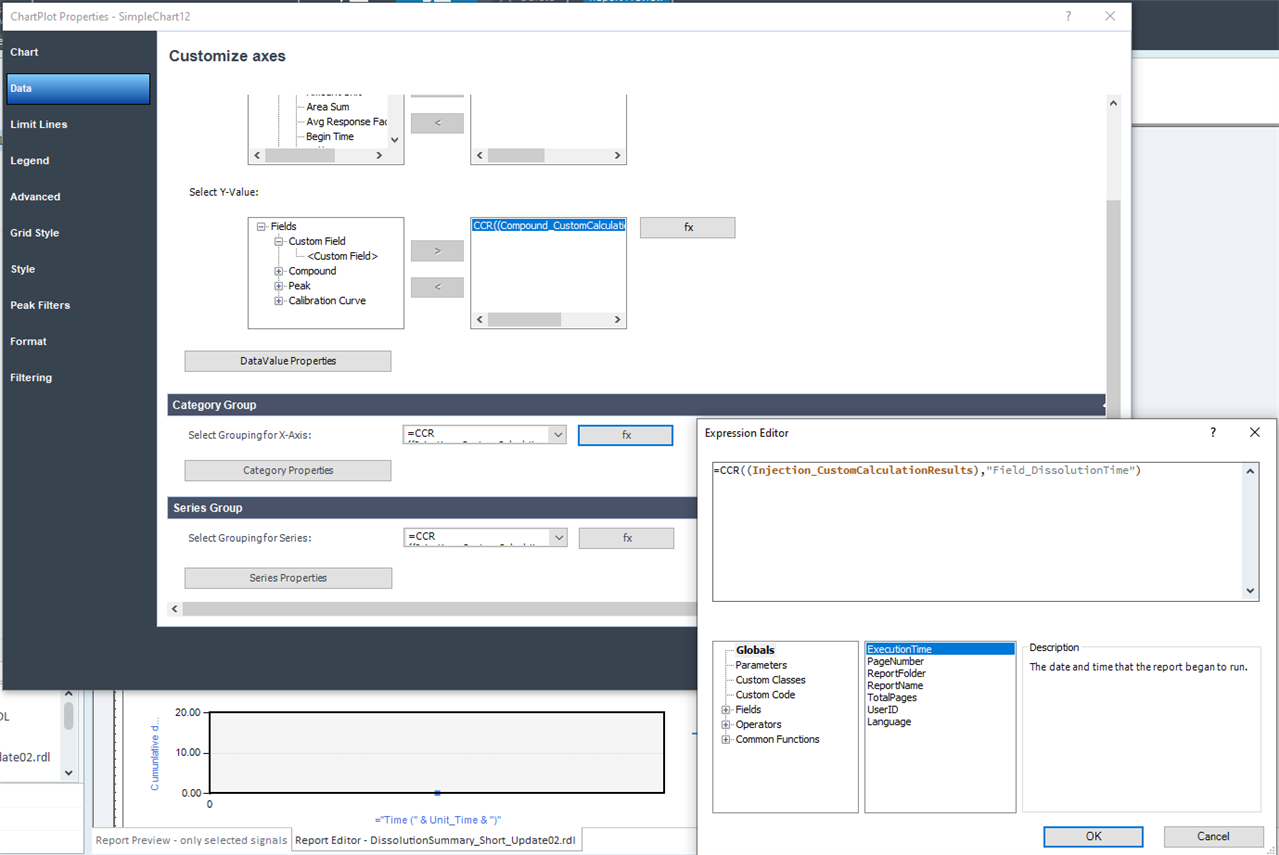
    It is just a scatter lines chart setup using custom calculations as the values for the chart. I use custom calculation fields to grab the time, capsule, and cumulative release percentage. It should be possible to use IR variables in the place of CC results. We use CC as in IR it is hard to do the CR correction from previous time points. I cannot give out the entire solution since this is part of the custom dissolution package. 

    Marty 

Children
Was this helpful?