Hello
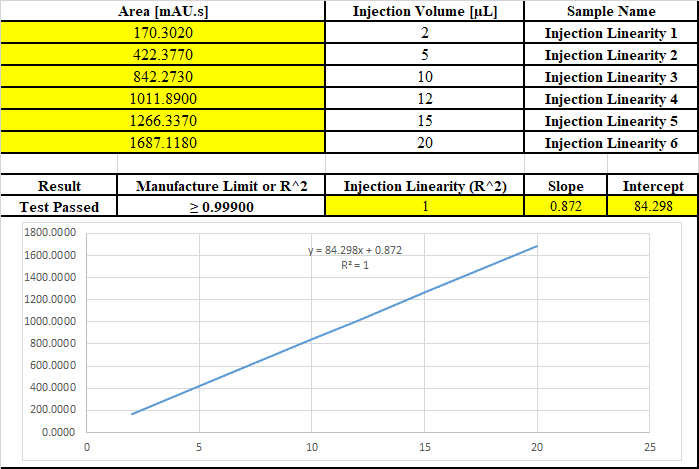
I need to draw the output of R^2 and the graph of two special parameters in the report. for example, injection volume VS Area. I wanted to see if such a possibility exists? Sample image is attached.
Hello
I need to draw the output of R^2 and the graph of two special parameters in the report. for example, injection volume VS Area. I wanted to see if such a possibility exists? Sample image is attached.