Hello
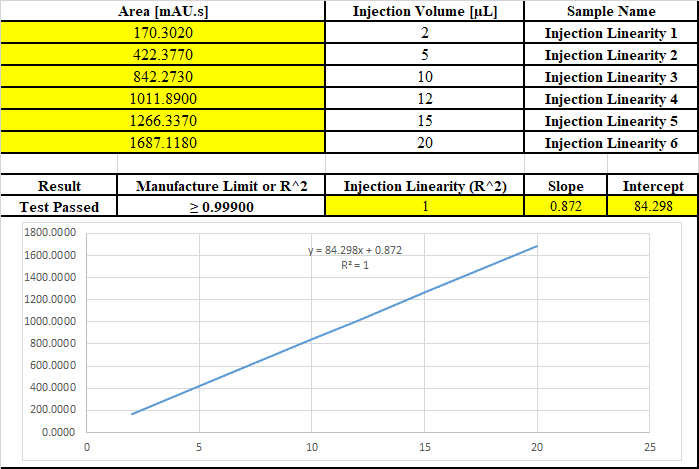
I need to draw the output of R^2 and the graph of two special parameters in the report. for example, injection volume VS Area. I wanted to see if such a possibility exists? Sample image is attached.

Hello
I need to draw the output of R^2 and the graph of two special parameters in the report. for example, injection volume VS Area. I wanted to see if such a possibility exists? Sample image is attached.

Hello,
You can chart the data in IR but it will not give you all the information you want. I would suggest you use the calibration workflow to generate the curve. You would just setup a calibration curve and runs the injections as standard levels. You can enter the injection volume as the level amount in the method to calibrate based on the injection volume.
Marty
Hello martin,
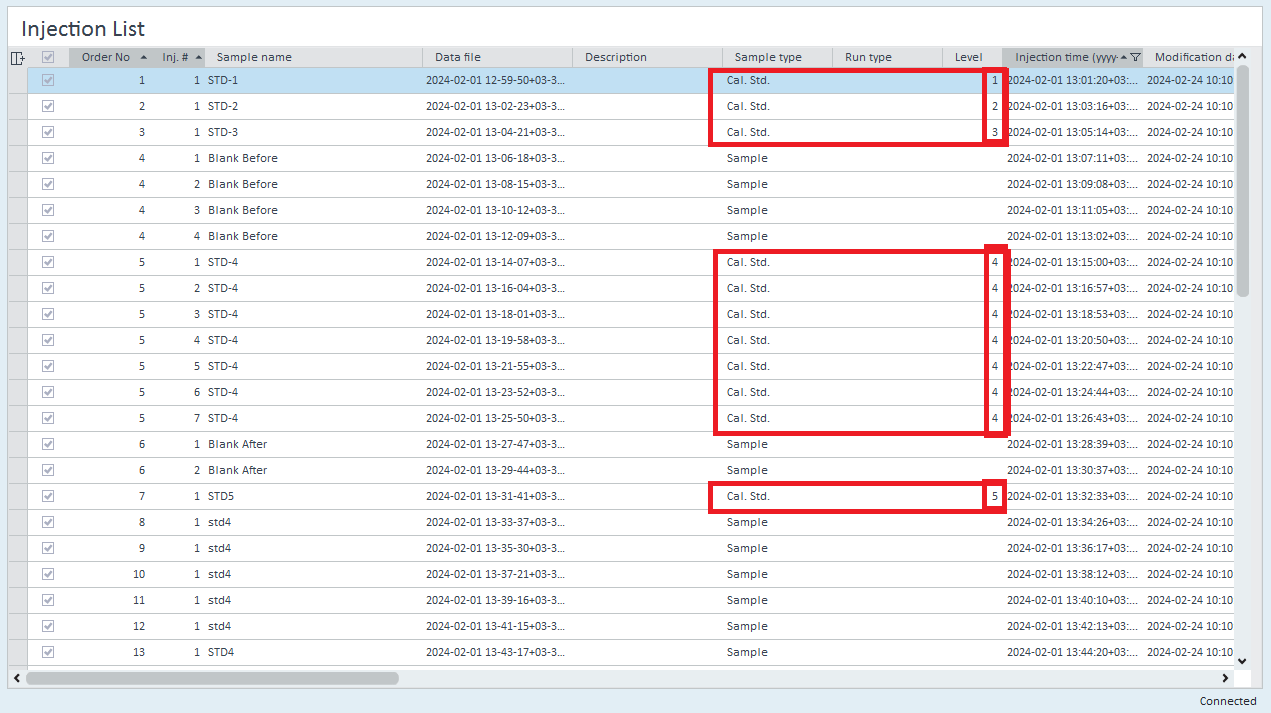
According to the picture below, when I want to draw the calibration curve, I put the level corresponding to the standard solution in the level column. As you said, should I put the sample volume in the level column?

Hello,
No, the level column corresponds to the level values in the method, so in the processing method you would assign the level amounts as the injection volumes. If you do a standard calibration and a linearity test in the same sequence, then you may want the linearity injection processed with a separate processing method.
Marty Adams

thank you Marty.